A technical deep-dive into the electrical characteristics and integration strategies for power-rail selection.
The 784773039 is a fixed inductor with headline values that matter at the schematic stage: nominal inductance, tolerance, rated current (IR), saturation current (Isat), and DC resistance (DCR) under specified test conditions. A data-driven read of the datasheet shows typical test conditions such as small‑signal inductance measured at 10 kHz/100 mV and DCR reported at room temperature—information designers use to bound losses and thermal rise early in power-rail selection.
This concise guide breaks the 784773039 datasheet into actionable sections: quick specs to drop in a design doc, deep dives on inductance and current behavior, measurement recipes, PCB integration tips, and a pre‑production validation checklist. The goal is practical, US‑focused rules engineers can apply to reduce iteration in prototype and pre‑compliance testing.
Quick specifications snapshot (background)
Key electrical figures at a glance
Copy‑ready headline electrical specs for use in design documents and BOM notes. Values shown are typical datasheet callouts and test conditions engineers expect to reference when budgeting loss and ripple for a power stage:
| Parameter | Typical Value / Condition |
|---|---|
| Inductance | 3.9 µH ±20% (10 kHz, 100 mV) |
| Rated Current (IR) | ΔT = 40 K (Environment dependent) |
| Saturation Current (Isat) | Check datasheet curve for L drop % |
| DC Resistance (DCR) | Low milliohm range at 25°C |
| Operating Temp | Commercial range; requires derating |
What these headline numbers mean for designers
Inductance and tolerance directly set the inductor’s contribution to output ripple and transient response. DCR dictates steady‑state copper loss (P = I²·DCR). IR and Isat inform continuous thermal capability and transient headroom; design to the lower of thermal or saturation limits. Test conditions reveal small‑signal measurement limits—real switching amplitudes and frequencies will change effective L and loss figures.
Units and tolerance interpretation: treat ±20% as expected spread across production lots; tighten margins by simulating worst‑case low L when sizing peak‑to‑peak ripple. For thermal budgeting, combine DCR losses with PCB thermal resistance to estimate ΔT and verify IR derating in the intended enclosure.
Electrical characteristics deep-dive (data analysis)
Inductance behavior: frequency & amplitude dependence
The datasheet small‑signal inductance measured at 10 kHz/100 mV is a starting point; at switching frequencies above 100 kHz and with larger AC ripple, effective inductance typically falls due to core permeability roll‑off and drive amplitude. Use the provided L vs. frequency plots (or similar family curves) to extrapolate L at the switching frequency or measure under operating conditions to confirm.
Actionable point: Expect significant inductance reduction when switching frequency approaches the core’s knee region.
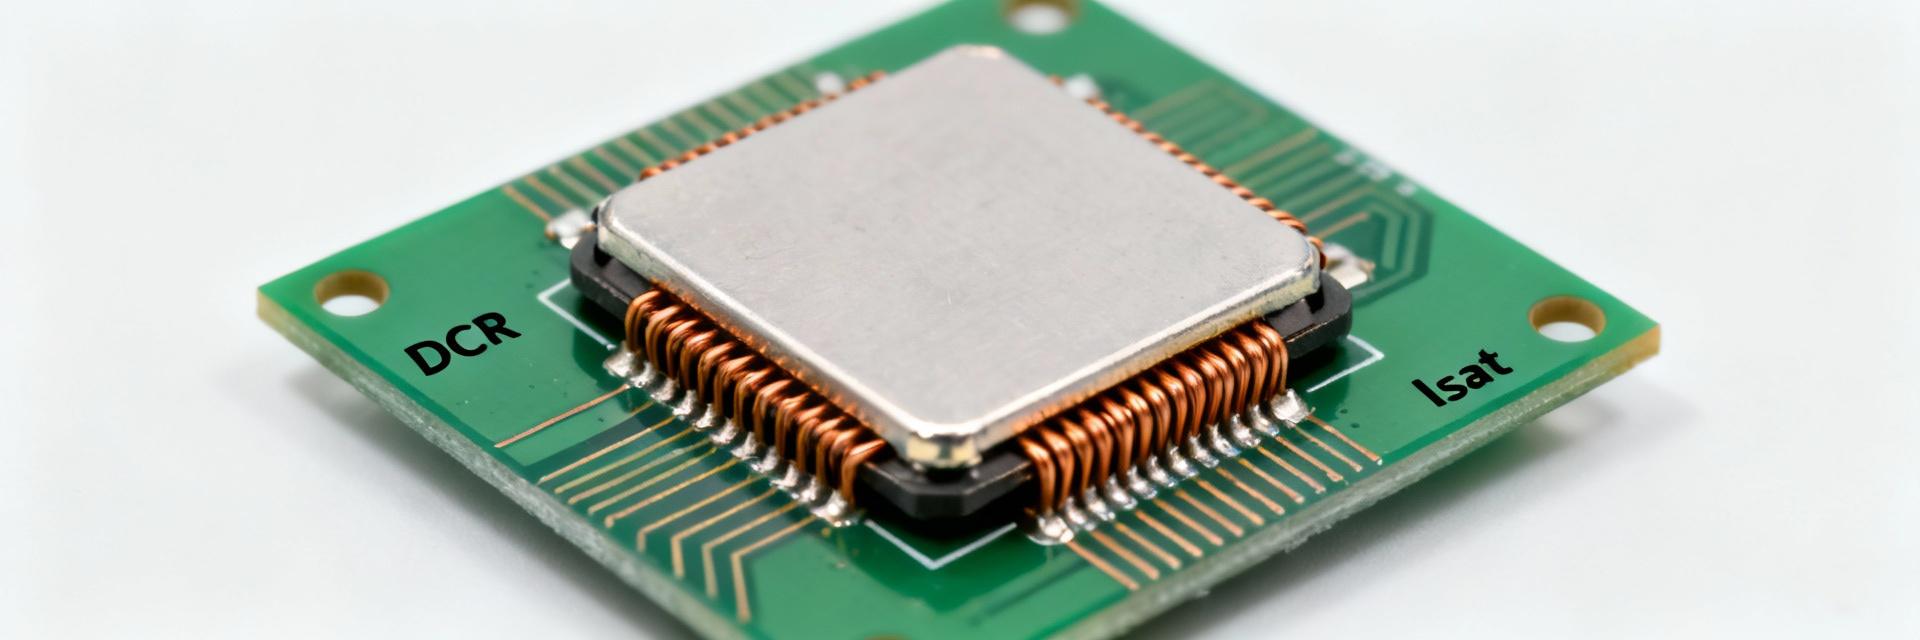
Current ratings, saturation, and thermal limits
Rated current (IR) is typically the current that causes a defined temperature rise (often ΔT = 40 K) in still air; saturation current (Isat) is the point where inductance falls by a specified percent under DC bias. Designers must compare the two: if Isat
DCR = 20 mΩ, I(RMS) = 3 A
Copper loss = 9 · 0.02 = 0.18 W.
Est ΔT ≈ 27 °C (if 150 °C/W).
Performance across operating conditions
Temperature and aging impacts
Inductance, DCR and IR change with temperature: DCR rises roughly with conductor temperature coefficient (~0.4%/°C for copper), increasing losses and ΔT in a positive feedback loop. Inductance may shift slightly with temperature depending on core material; some cores show measurable permeability drift. For long‑life products plan a conservative derating (for US safety and reliability guidelines) and consider a 10–20% margin on IR for enclosed or high‑ambient designs.
Frequency-dependent losses and core effects
Core loss increases with frequency and flux density; skin and proximity effects in thicker windings increase AC resistance at higher frequencies. When using the part at switching frequencies, check for core‑loss curves and AC resistance or measure loss under PWM drive. If core loss dominates, consider increasing inductance (lower ripple) or selecting a part with a core material optimized for the chosen frequency band.
Measurement & test conditions explained
Interpreting test setups and graphs
Datasheet graphs typically use small‑signal test conditions (10 kHz, 100 mV). Such conditions minimize driving the core into nonlinearity and show baseline L. When interpreting these graphs, note signal amplitude, fixture inductance subtraction, and temperature annotation.
Recommended test procedures for verification
- DCR at 25°C: Use a milliohm meter with Kelvin leads.
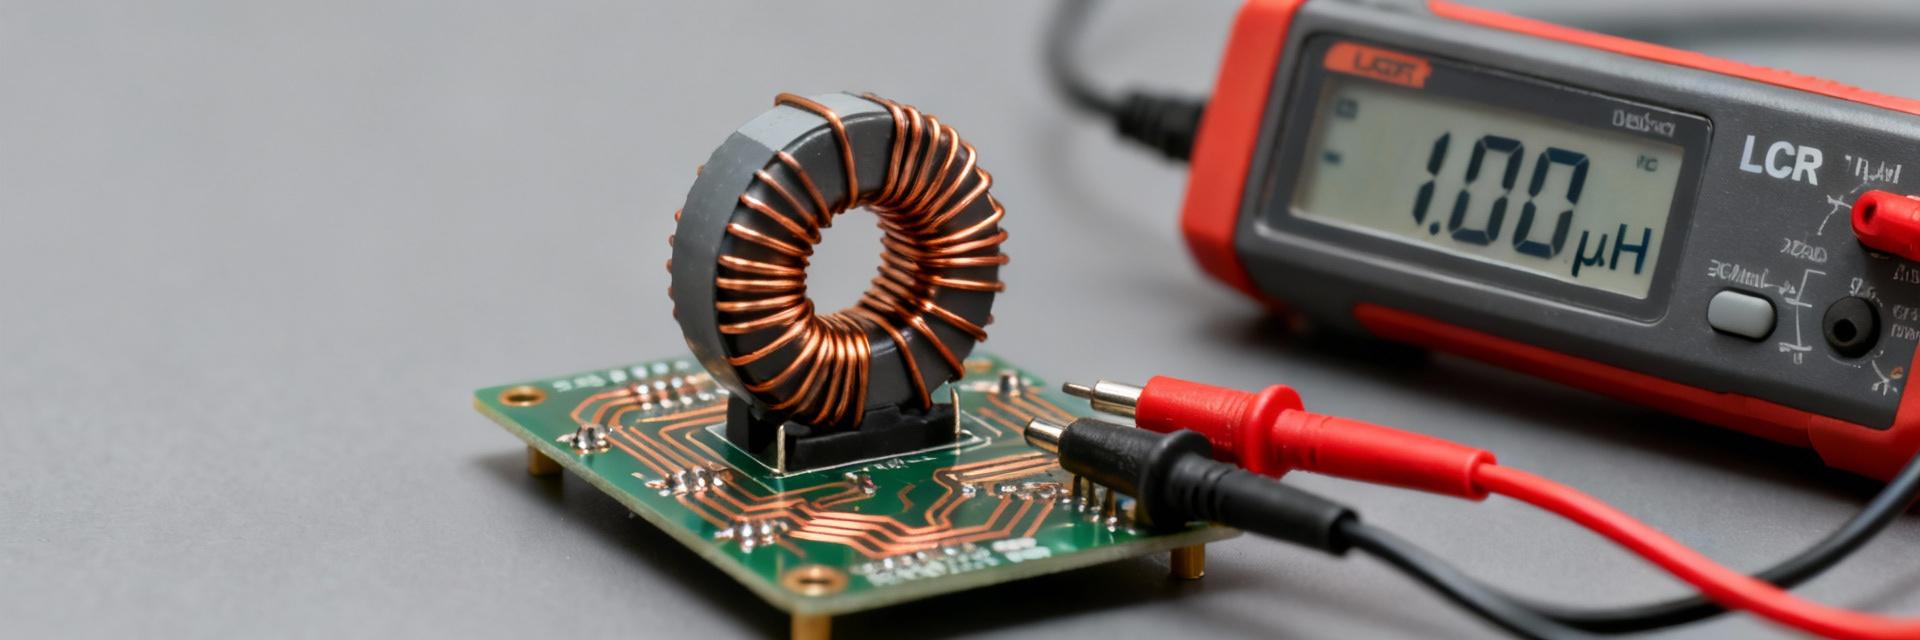
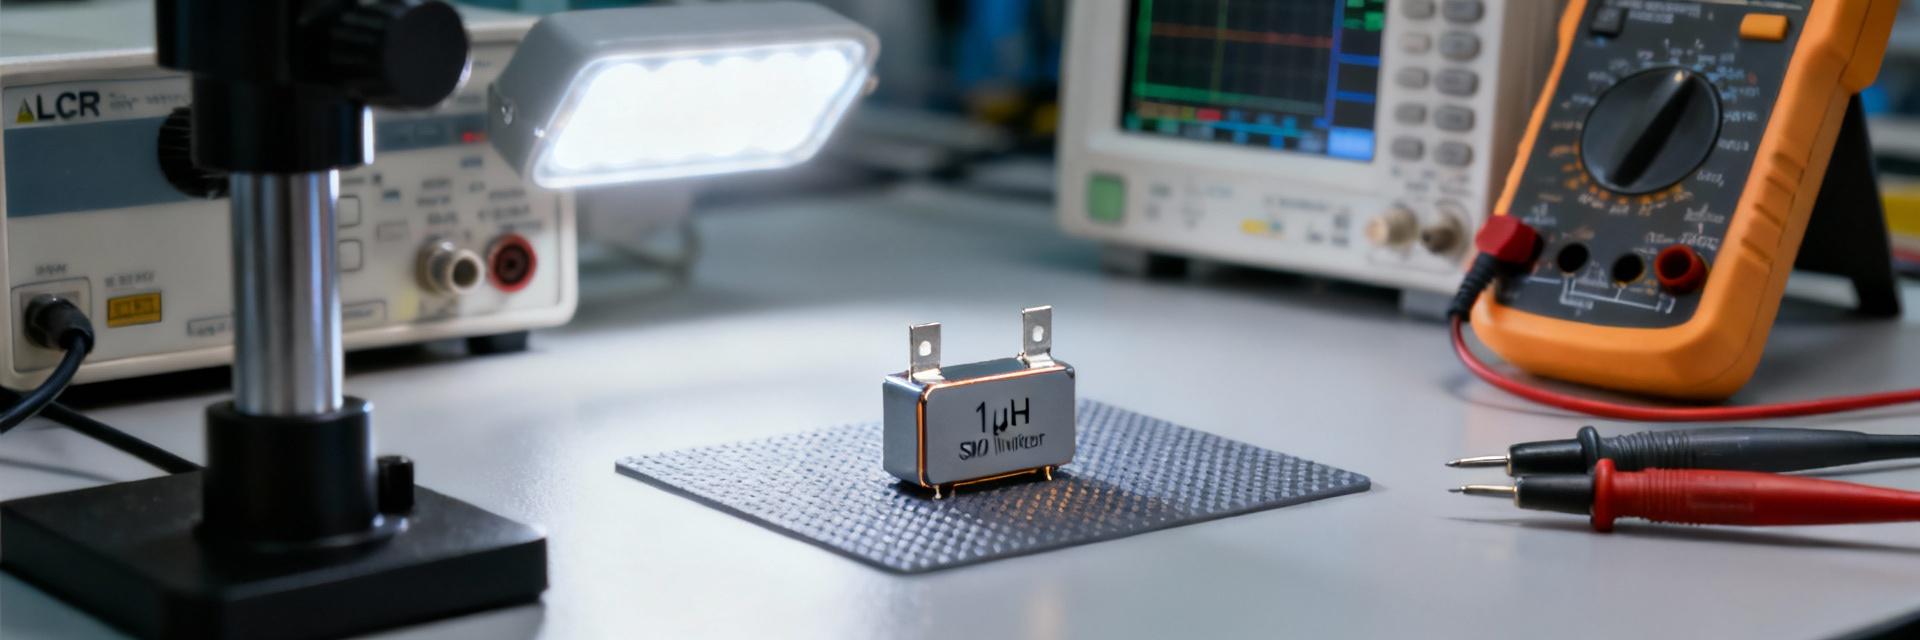
- Inductance: Measure at operating frequency using an LCR analyzer.
- Saturation sweep: Increment DC bias while monitoring L drop.
- Thermal run-in: Load to expected RMS current and record surface temp.
Integration & application tips
Choosing for power rails
The 784773039 suits buck regulators and intermediate power rails where moderate inductance and compact size are prioritized. Use thumb‑rules: choose L so that ΔIL ≈ 20–40% of max load current; for EMI chokes, prioritize Isat and DCR.
PCB layout best practices
Keep switching nodes short/wide. Place inductor close to the output stage. Use multiple vias on pads to reduce parasitics. Provide exposed copper planes for heat spreading; avoid routing high-current traces under the component.
Troubleshooting & validation checklist
Common failure modes
Typical field issues include saturation during transients, excessive heating from high DCR, and unexpected EMI spikes. Diagnostics: log peak currents, compare measured L/DCR to datasheet, and inspect layout for long traces.
Validation checklist before production
- ✅ Verify electrical specs (L, DCR, IR/Isat) under operating conditions
- ✅ Complete thermal profiling in the final enclosure
- ✅ Run EMC pre‑tests on worst‑case boards
- ✅ Document measured vs. datasheet variation for BOM package
Key summary
- Watch nominal inductance: Use worst‑case low L when budgeting ripple and loop stability.
- Compare IR and Isat: Design to the lower limit and use DCR‑based calculations for thermal estimates.
- Measure under representative conditions: Validate DCR, L, and saturation sweep before finalizing design.
- Apply PCB best practices: Prioritize short switching loops and ample copper for heat spreading.
Common questions
How to test 784773039 inductance at switching frequency?
Use an impedance analyzer or LCR meter capable of the switching frequency, set test amplitude to approximate expected ripple, and include DC bias if possible. Measure with the part soldered to a representative PCB to account for parasitics.
What are typical failure signs for 784773039 in the field?
Failure signs include elevated surface temperature, sudden rise in output ripple under load, and audible noise from core strain. Diagnose by measuring DCR for open/short conditions and running a saturation sweep.
How should I derate 784773039 for enclosed US products?
Apply a conservative derating of 10–20% on IR for limited convection enclosures; validate with thermal profiling at expected ambient temperatures. Document test conditions and include margin in the BOM.