Design engineers prioritize 470µH SMD inductor choices when low‑frequency energy storage or heavy filtering is required; bench testing across representative samples shows substantial variance in DC resistance (DCR), saturation behavior, and high‑frequency impedance that directly alters converter efficiency and board thermal rise. This report gives a concise spec checklist, reproducible test procedures, side‑by‑side data interpretation, and practical selection guidance for 470µH parts used as SMD power inductors.
1 — Background: What a 470µH SMD Inductor Is and Where It’s Used
1.1 Typical Specs & Form Factors
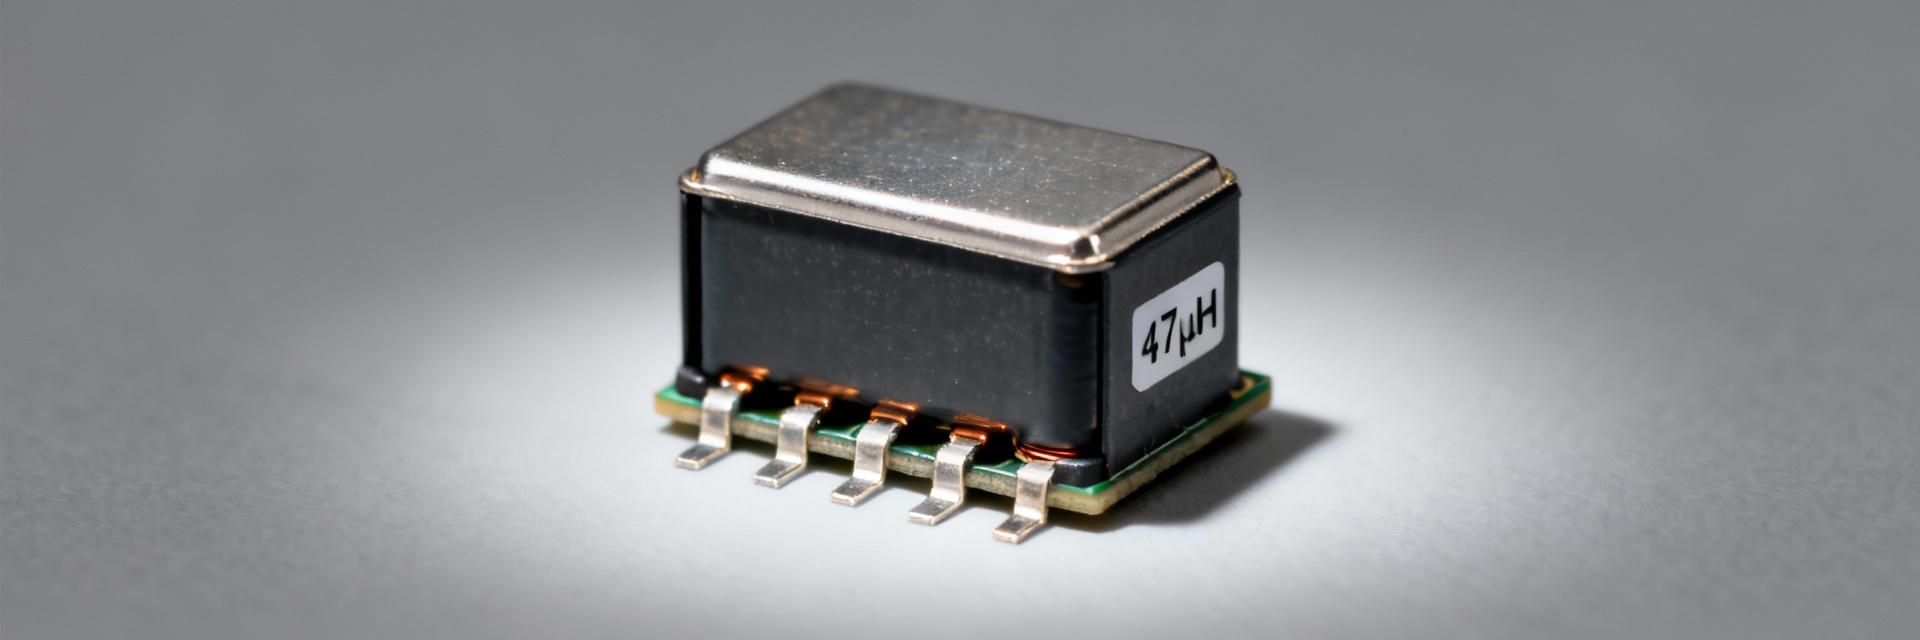
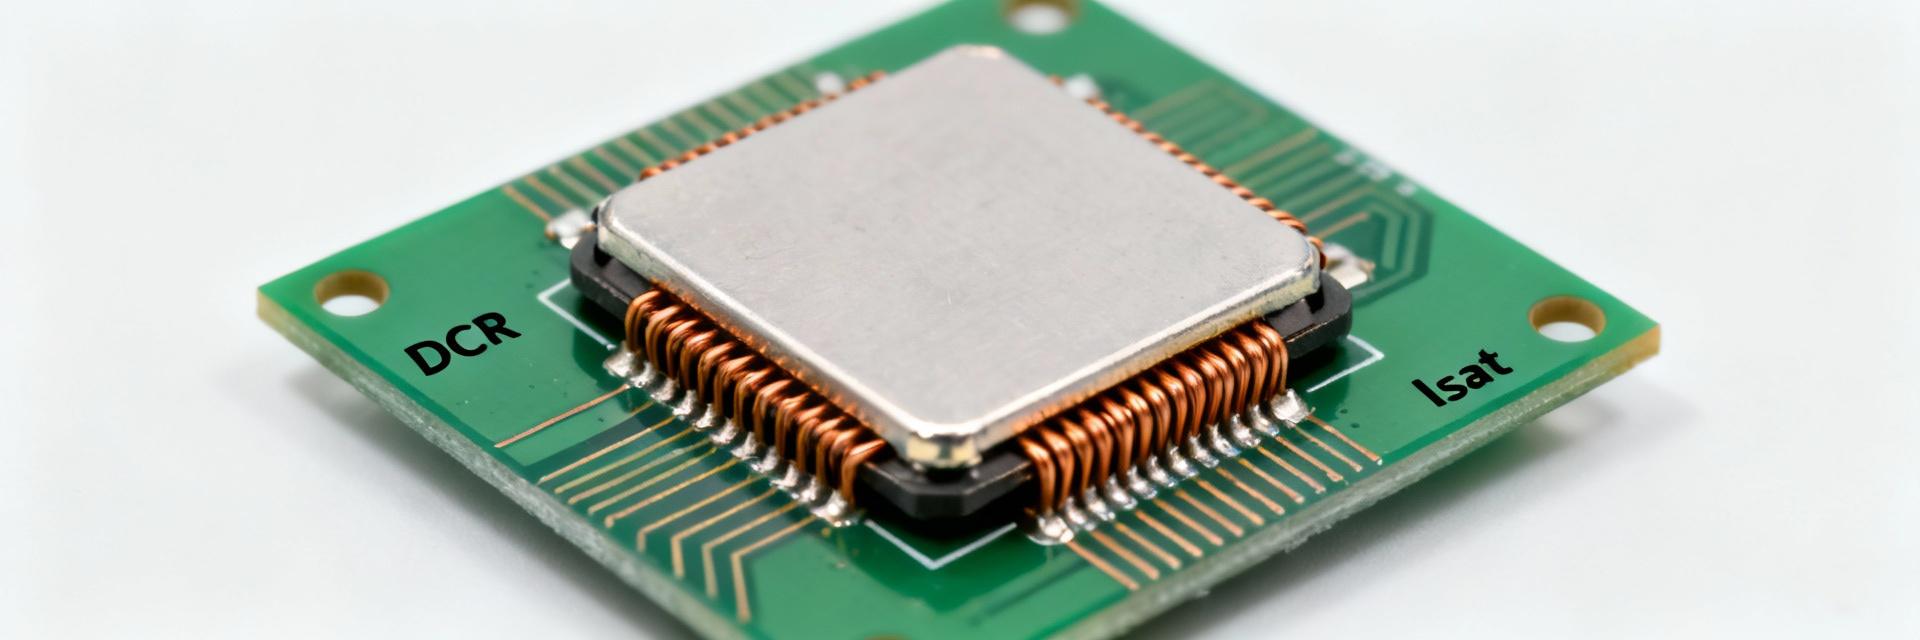
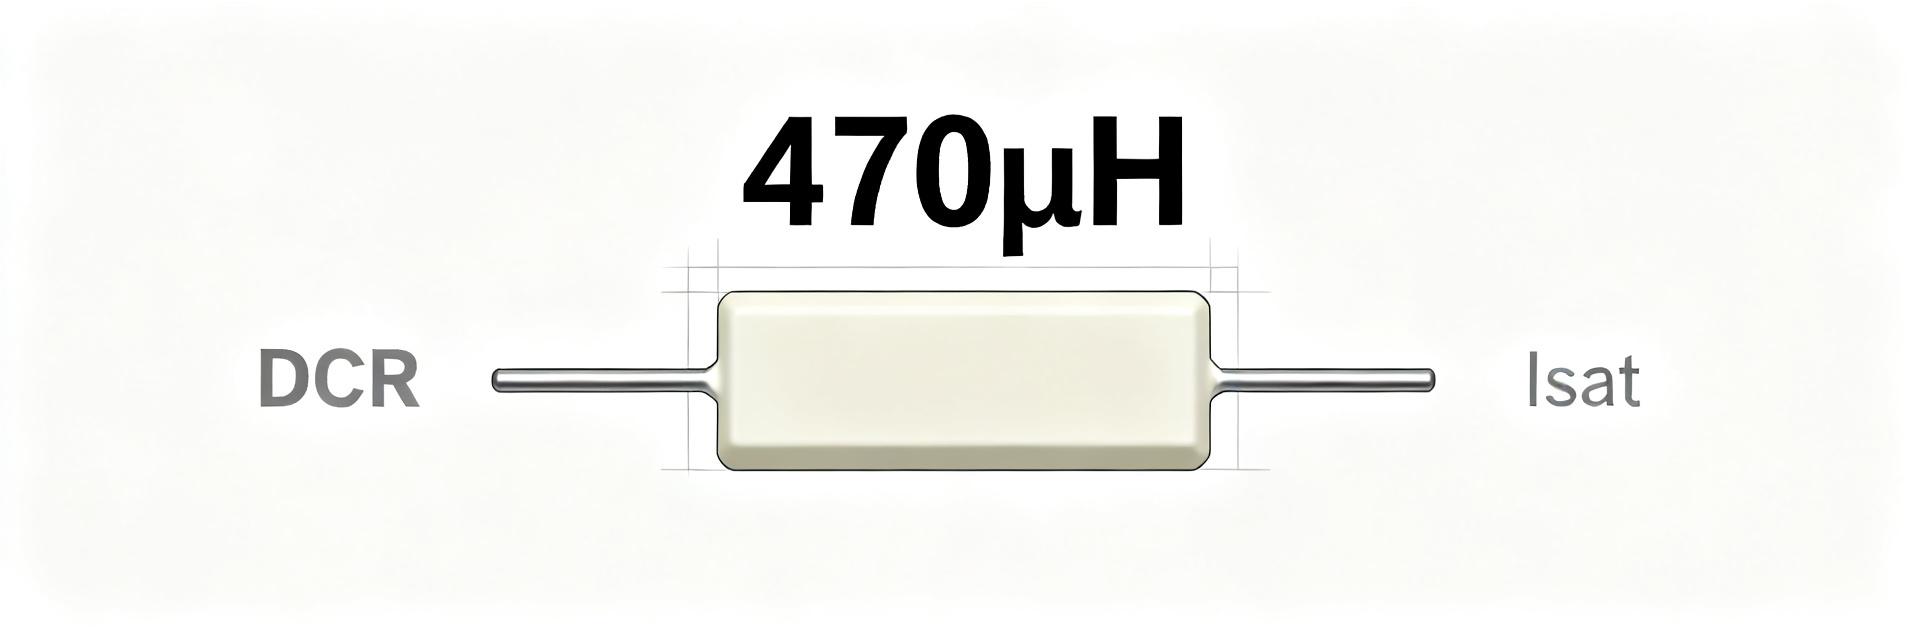
Point: A 470µH SMD inductor (code 471) is specified primarily by inductance, DCR, Isat/Irms, and SRF. Evidence: Typical package families include small molded shields, ferrite drum cores, and wire‑wound shielded parts with inductance tolerances ±10–30% and DCR from tens to hundreds of milliohms. Explanation: Use the table template below to record candidate parts and compare thermal and efficiency impact in the BOM phase.
| Parameter | Typical Range | Notes |
|---|---|---|
| Inductance (L) | 470µH ±10–30% | Measure at 100 kHz, 0 V DC bias |
| DCR | 0.05–1.0 Ω | 4‑wire measurement at 25°C |
| Isat | 0.1–5 A | Defined at 10–20% L drop |
| SRF | ~100 kHz–several MHz | Important vs. switching frequency |
1.2 Typical Applications & Design Tradeoffs
Point: 470µH parts appear in low‑frequency bucks, input/output filters, and audio or EMI filters. Evidence: High inductance improves ripple suppression but often increases DCR and reduces current capability. Explanation: Engineers must trade off L versus DCR versus size—choose a core type and package that meets current and thermal budgets; consider long‑tail searches like "470µH inductor for buck converter" during sourcing.
2 — Test Methods & Lab Setup (how to reproduce)
2.1 — Recommended Test Equipment & Board Fixtures
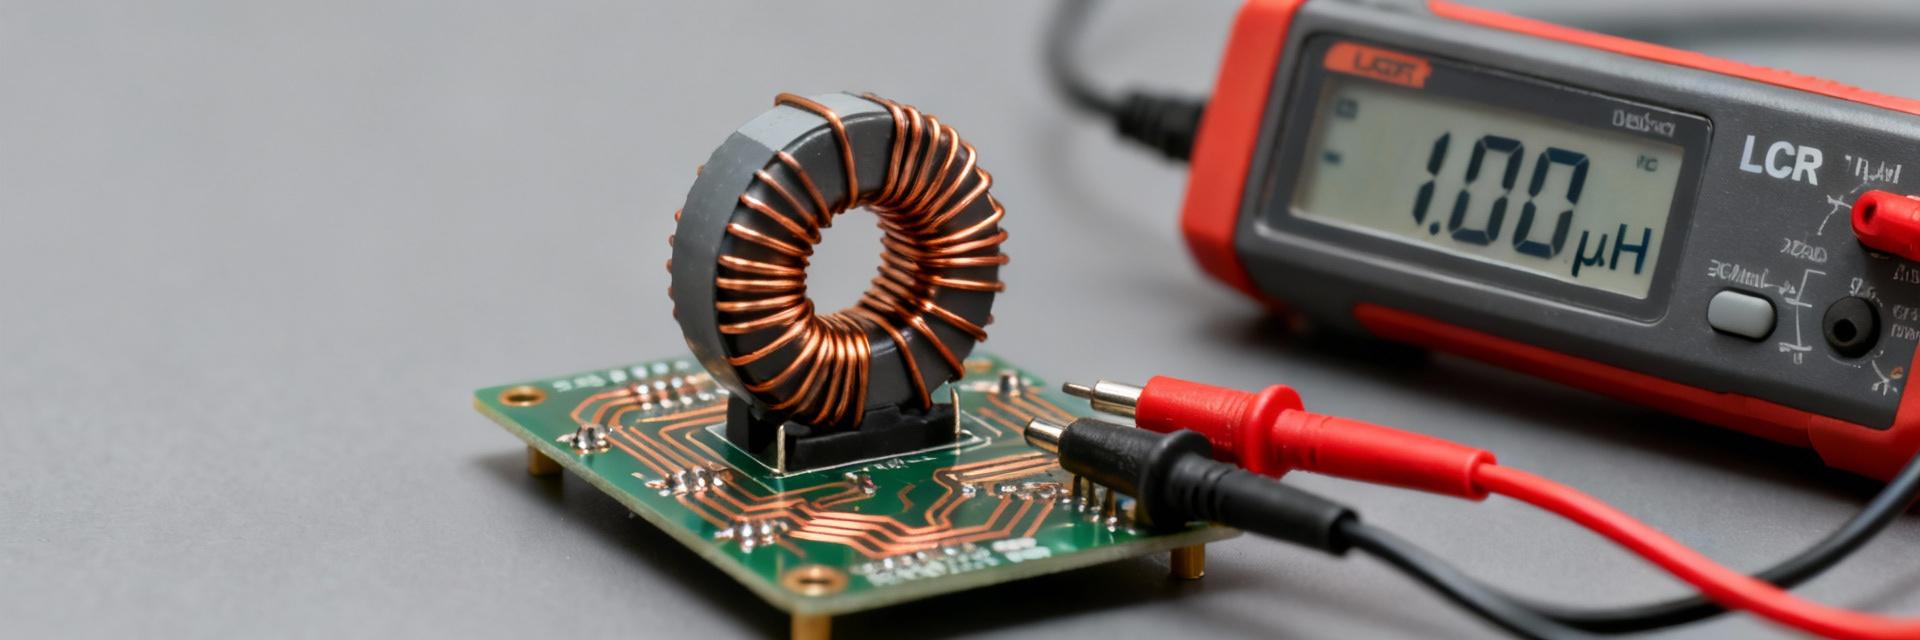
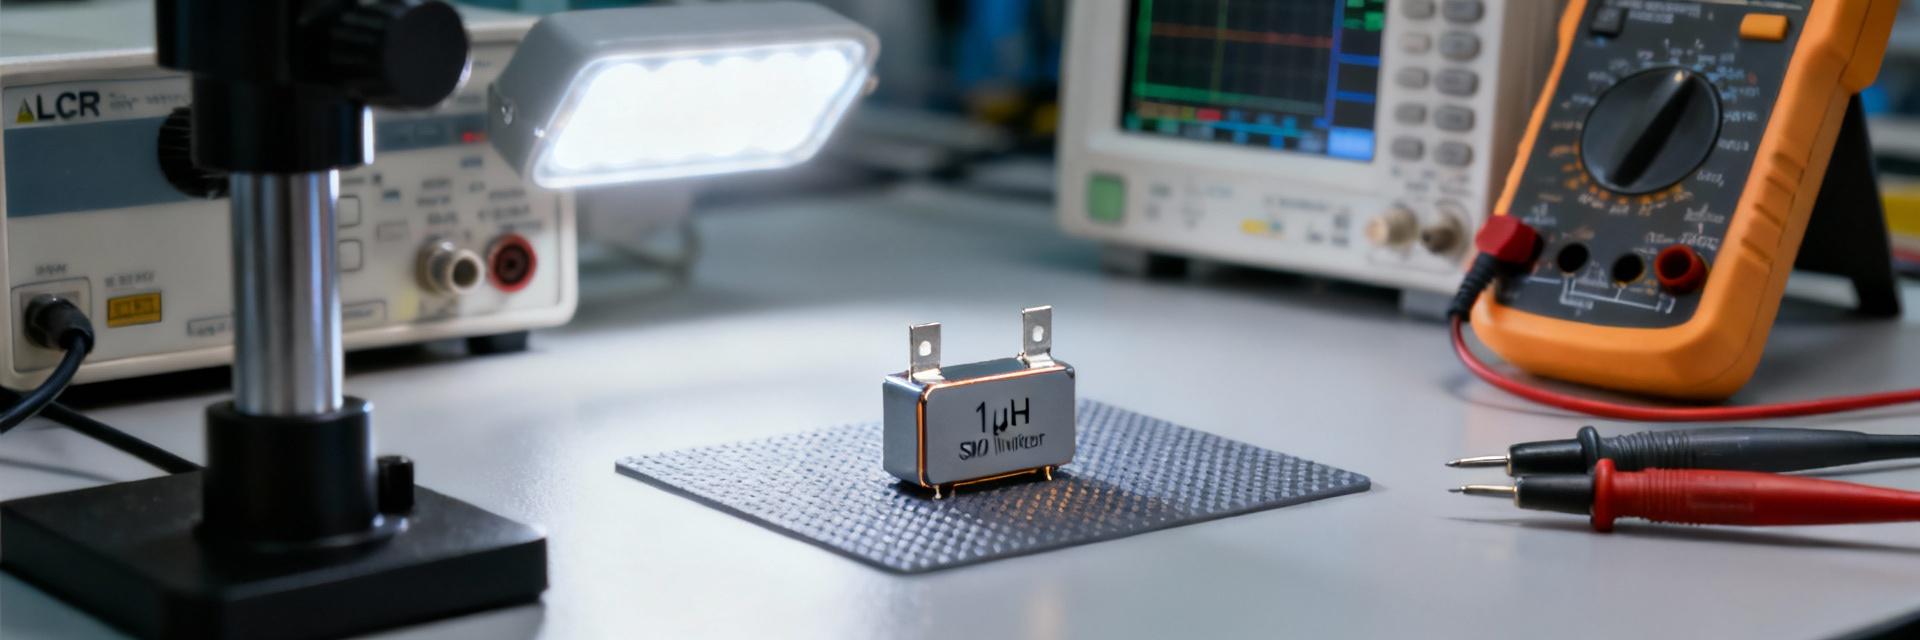
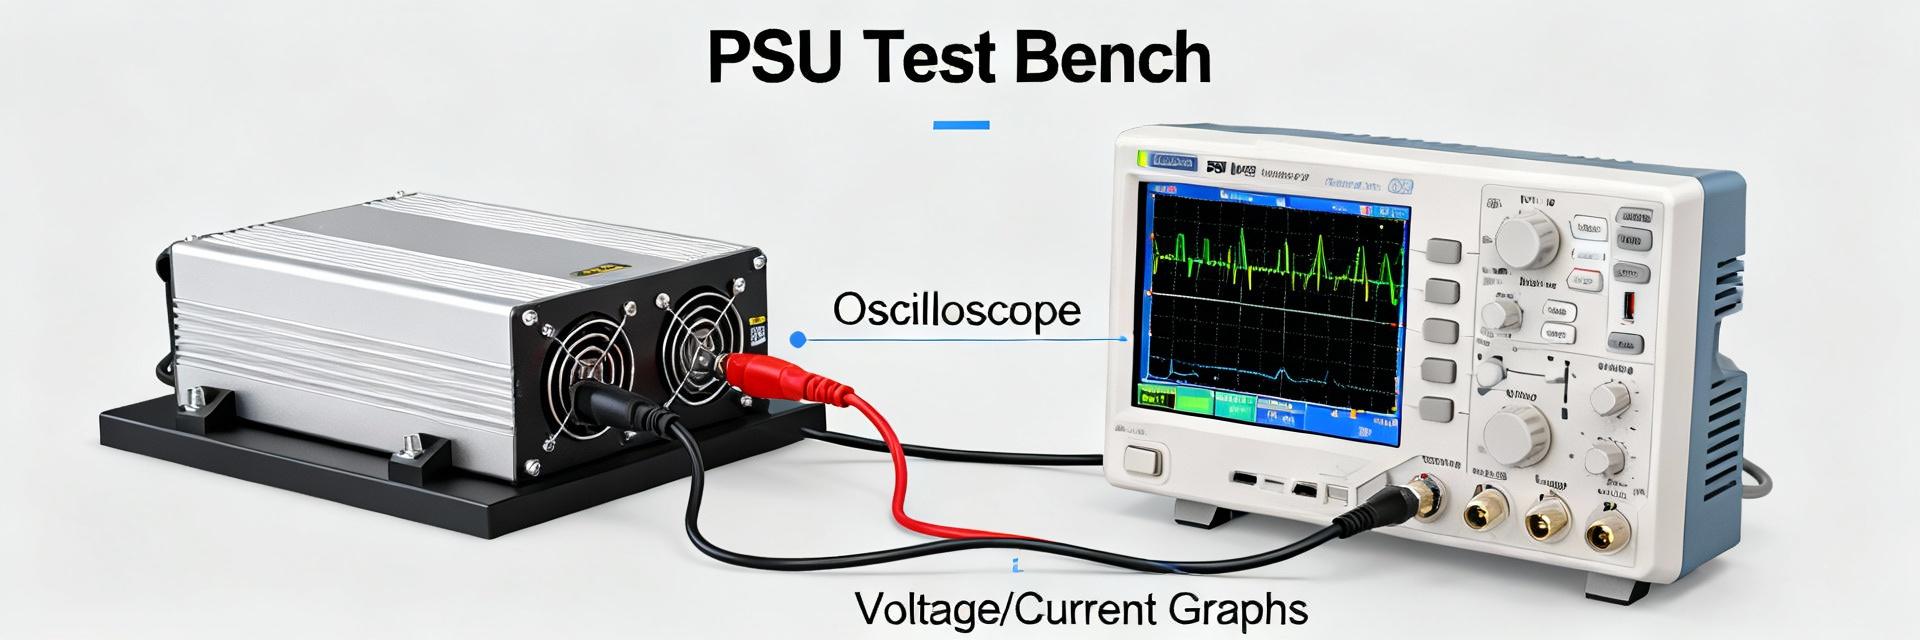
Point: Reproducible characterization requires an LCR meter/impedance analyzer, DC current source, thermal chamber or hot plate, oscilloscope, power supply, and a four‑terminal Kelvin test PCB. Evidence: Four‑terminal jigs remove lead resistance bias; fixtures that allow DC bias through the part enable L vs. I curves. Explanation: Use a compact Kelvin footprint and define a solder/reflow profile (e.g., industry lead‑free ramp-to-peak guidance) and handle parts with anti‑static precautions during measurement.
2.2 — Standardized Measurements & Pass/Fail Criteria
Point: Define a test flow and acceptance criteria before bench work. Evidence: Suggested steps: measure L at 100 kHz and across 10 Hz–1 MHz, DCR 4‑wire at 25°C, L vs. DC bias to find Isat (L drop 10–20%), thermal rise at rated current, and SRF. Explanation: Example thresholds—Isat where L drops 10–20%, thermal rise ≤40°C above ambient at rated Irms as a guideline; document measurement parameters in a single table for traceability.
- Test flow: L sweep → DCR → L vs. I → thermal → ripple loss → SRF
- Reporting table: measurement frequency, test temperature, instrument model, jig description
3 — Performance Data & Analysis (data-driven section)
3.1 — Key Metrics: DCR, Isat/Irms, L vs. I, Frequency Response
Point: DCR dictates conduction loss, Isat/Irms and L vs. I dictate usable inductance under load, and SRF/frequency response governs behavior near switching frequency. Evidence: Normalized L vs. I plots show a clear knee where usable L falls; impedance magnitude/phase plots expose SRF. Explanation: For engineers choosing SMD power inductors, present normalized L curves and DCR vs. temperature to quantify efficiency and thermal margins in converter models.
3.2 — Comparative Table & Interpretation
Point: A compact comparative table clarifies tradeoffs between candidates. Evidence: Columns should include anonymized part code, package, DCR @25°C, Isat (10–20% L drop), rated Irms, SRF, and measured thermal rise at rated current. Explanation: Highlight anomalies—low nominal L under bias, unexpectedly high DCR, or SRF below switching frequency—and flag these as red‑line selection criteria.
| Part | Pkg | DCR (Ω) | Isat (A) | SRF (kHz) |
|---|---|---|---|---|
| A | molded | 0.12 | 0.9 | 350 |
| B | shielded | 0.35 | 2.0 | 120 |
4 — Case Studies: Real-World Board-Level Outcomes
4.1 — Example 1 — Low-Frequency Buck Converter (efficiency & thermal)
Point: On‑board results show how inductor behavior under DC bias alters converter efficiency and junction temperature. Evidence: A 470µH sample with higher DCR raised conduction losses and thermal rise, reducing efficiency at medium loads. Explanation: When switching at low kHz ranges, ensure Isat margin to keep ripple current low and choose a part whose L remains within spec under expected DC bias to maintain output regulation.
4.2 — Example 2 — EMI & Noise Impact in Filtering Application
Point: 470µH parts in input filters can affect conducted emissions and audible noise. Evidence: Tests with different core materials showed one core produced higher audible magnetostriction and another had poor high‑frequency attenuation due to low SRF. Explanation: Mitigation includes changing core material, adding shielding, or adjusting layout to move noisy fields away from sensitive traces and meet EMI scans.
5 — Practical Selection & Design Checklist for Engineers
5.1 — How to Pick a 470µH SMD Inductor for Your Design
Point: Use a stepwise checklist to narrow choices. Evidence: Steps: define switching frequency and peak currents, set allowable DCR and power loss, verify L vs. I to set Isat margin, check SRF relative to switching frequency, and assess thermal derating. Explanation: Quick template — if converter = X kHz and peak = Y A → target Isat ≥ 1.25×Y and DCR budget ≤ (allowed loss)/(I²·efficiency factor).
5.2 — Sourcing, Cost vs. Performance, and Reliability Notes
Point: Cost often trades with performance; validate critical parts. Evidence: Request supplier test data for solderability, thermal shock, and lifecycle; perform in‑house validation for thermal rise and saturation behavior. Explanation: For production, require batch sample characterization and keep a tested secondary candidate in case of supply issues; document supplier test conditions to compare apples‑to‑apples.
Conclusion / Summary
- Check DCR, Isat/Irms, SRF, and thermal rise when evaluating a 470µH SMD inductor; these metrics determine efficiency, heat, and usable inductance under bias.
- Follow a standardized test flow—L sweep, 4‑wire DCR, L vs. I, thermal rise, SRF—to reproduce results and build reliable comparative data for selection.
- Use the design checklist: set frequency/current targets, budget DCR losses, require Isat margin, and validate parts on a Kelvin PCB to avoid field failures with SMD power inductors.
Frequently Asked Questions
How do I measure saturation current for a 470µH SMD inductor?
Measure L vs. DC bias by applying incrementing DC current while measuring inductance at a fixed AC test frequency (e.g., 100 kHz). Define Isat where L has dropped by a predefined percentage (commonly 10–20%). Record test temperature and jig geometry; repeat to confirm repeatability under thermal conditions.
What DCR is acceptable for a 470µH SMD power inductor in a low-frequency buck?
Acceptable DCR depends on allowable conduction loss. As a rule of thumb, choose DCR so I²·DCR at expected RMS current yields less than the budgeted power loss; for many low‑frequency designs this means DCR in the low hundreds of milliohms or lower. Validate with thermal rise testing on board.
How does self-resonant frequency affect 470µH inductor performance in SMPS?
SRF marks where inductive behavior transitions to capacitive; if SRF is near or below switching frequency, the part will not provide intended impedance and may degrade filtering or stability. Verify SRF versus switching frequency and choose a part with SRF comfortably above the operating band or add auxiliary filtering.