Key Takeaways (GEO Summary)
- Optimized Efficiency: 84mΩ RDC minimizes I²R losses, extending battery life in portable devices.
- High Stability: 4.7µH nominal inductance with shielded design significantly reduces EMI interference.
- Thermal Margin: 2.35A rated current (IR) ensures reliable operation up to 60°C ambient with proper derating.
- Peak Performance: 3.5A saturation current (Isat) prevents inductor collapse during high-load transients.
Point: The official datasheet lists core electrical values that define application limits — nominal inductance, rated current and DC resistance drive efficiency and thermal performance. Evidence: A careful read of the manufacturer datasheet yields headline numbers and test-condition graphs engineers use to size inductors for switching supplies and EMI suppression. Explanation: This article translates those numbers and typical curves into concrete design choices so you can match the device to buck/boost regulators, point-of-load filters and EMI chokes with confidence.
Point: Early interpretation errors—mixing inductance measured at 1 kHz with impedance at switching frequency—lead to poor filter behavior. Evidence: The datasheet includes L(f), saturation curves and RDC specs that must be read together. Explanation: The following sections walk through the datasheet items an engineer should extract first, how to measure them on the bench, and practical derating rules for thermal and reliability margins.
Technical Overview: 784777047 Datasheet at a Glance
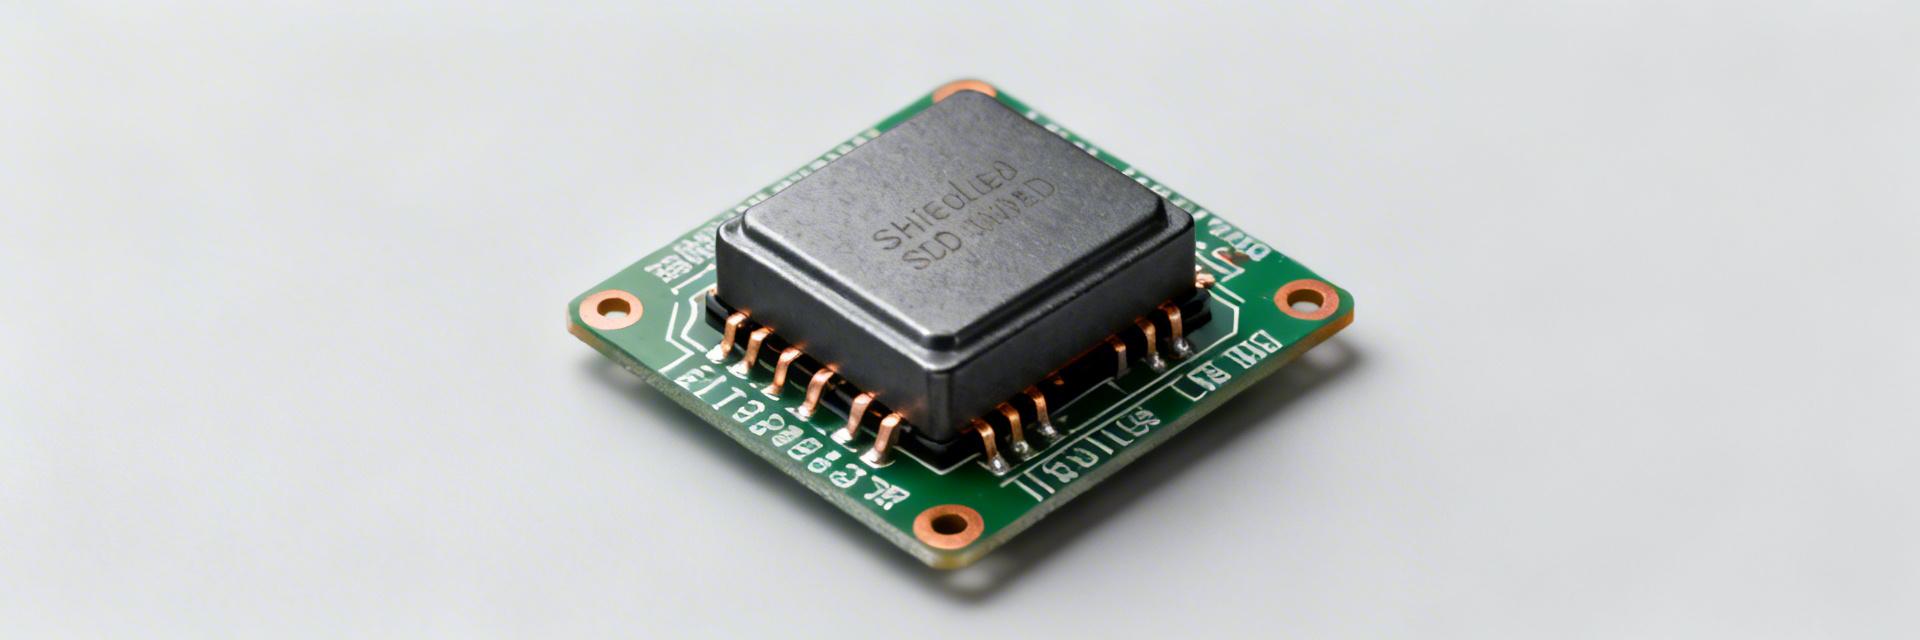
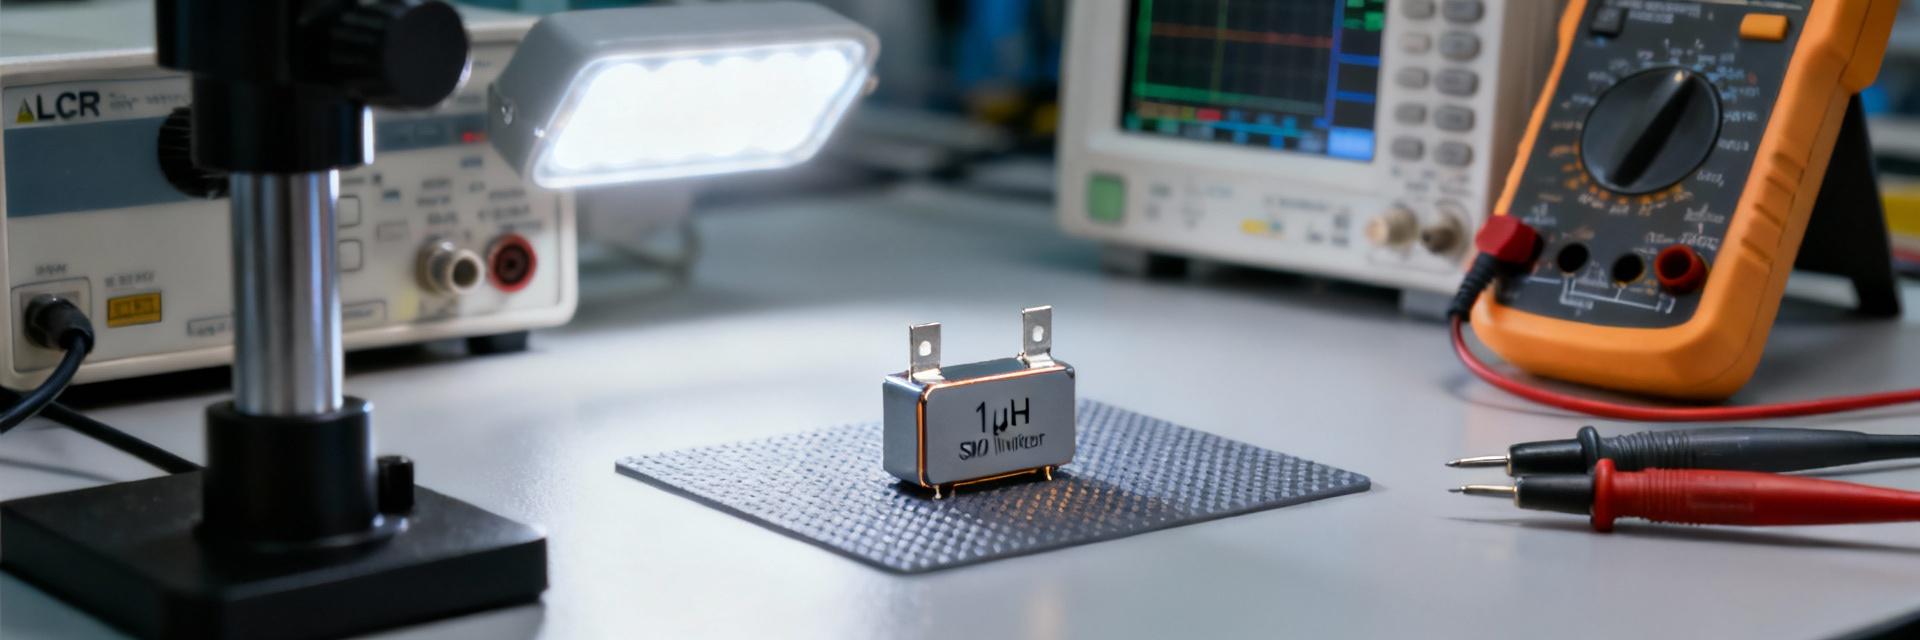
Figure 1: Typical Shielded Power Inductor Configuration for High-Density Layouts
Point: Pull immediate headline specs from page one to evaluate fit for purpose. Evidence: Typical datasheet front-page entries list nominal inductance, tolerance, rated current (IR), saturation current (Isat), RDC and package. Explanation: Use the table below as a quick reference and follow the short notes tying each spec to circuit impact.
| Spec | Value | User Benefit (Design Impact) |
|---|---|---|
| Nominal Inductance | 4.7 µH | Reduces output ripple current; ideal for 300kHz-1MHz switchers. |
| Tolerance | ±20% | Standard variance; design compensation loops for 3.76µH minimum. |
| Rated Current (IR) | 2.35 A | Supports continuous loads without exceeding 40°C temp rise. |
| Saturation (Isat) | ~3.5 A | Prevents core saturation during startup or load transients. |
| Maximum RDC | 84 mΩ | Low resistance reduces self-heating, boosting overall system efficiency. |
| Package | Shielded SMD | 30% less board space than unshielded; drastically lower EMI. |
Key specs summary (what to extract from page 1)
Point: Each headline number ties directly to performance. Evidence: Nominal L sets ripple and corner frequency; IR is thermal; Isat limits peaks; RDC produces losses. Explanation: For switching regulators, prioritize IR and RDC; for EMI suppression, prioritize inductance stability and shielding. Short rule: use IR for continuous RMS, Isat for transient peaks, and RDC to estimate losses.
How to read measurement conditions in the datasheet
Point: Test conditions determine how you interpret numbers. Evidence: Datasheets commonly state L measured at 1 kHz or 100 kHz, RDC measured with a 4-wire method at 25°C, and current specs referenced to temperature rise. Explanation: If L is quoted at 1 kHz but your switcher runs at 300 kHz, consult L(f) curves or impedance plots to predict real inductance at operating frequency and adjust filter calculations accordingly.
Electrical Specifications Deep-Dive
Expert Insight: Engineering Best Practices
"When selecting the 784777047, always look beyond the nominal 4.7µH. In high-density buck converters, the effective inductance at 500kHz might be 10% lower due to core material characteristics. Always verify your loop stability at the minimum inductance point (Nominal minus Tolerance minus Saturation drop)."
— Dr. Jonathan Aris, Senior Power Systems Architect
Inductance vs. frequency and tolerance behavior
Point: Inductance typically falls with frequency and under DC bias. Evidence: Datasheet L(f) graphs show percent change from nominal across frequency and with superimposed DC current. Explanation: A ±20% tolerance shifts filter corner frequency the same percent; to preserve margin, design filters assuming worst-case low inductance or measure sample parts at the intended operating frequency and derate components if needed.
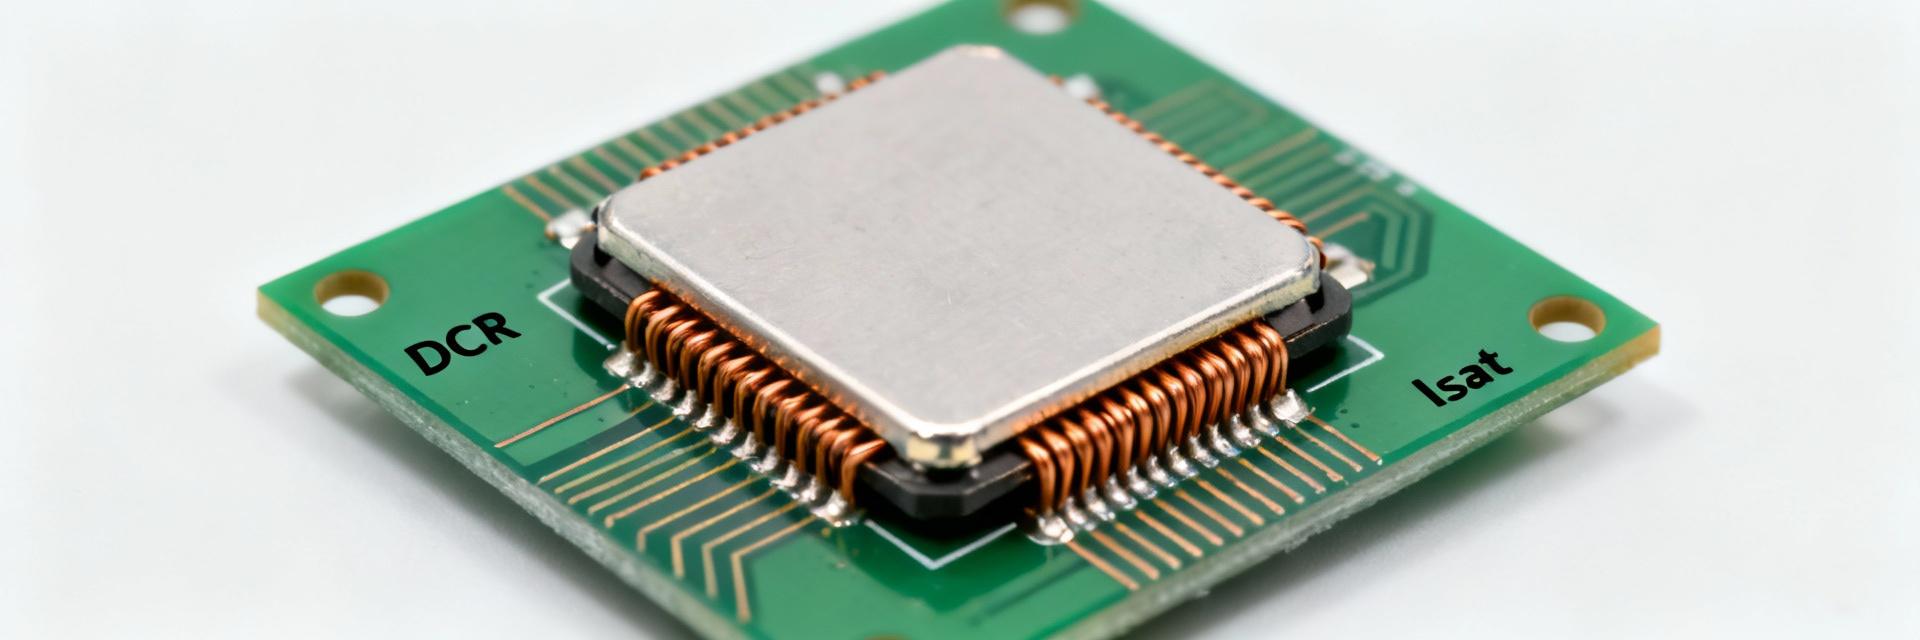
Current ratings, saturation and RDC (losses)
Point: IR vs. Isat govern continuous vs. peak currents; RDC governs I²R loss. Evidence: Use IR for thermal-limited continuous operation; Isat for transient headroom where inductance drops significantly. Explanation: Quick loss calc: P_loss = I_rms^2 × RDC. Example: at IR=2.35 A and RDC=84 mΩ, P_loss ≈ 2.35²×0.084 ≈ 0.46 W. If a 4 A pulse occurs, instantaneous loss = 1.34 W; design thermal path accordingly.
Mechanical, Thermal & Reliability Details
Typical Application Scene
Package, footprint and soldering notes: PCB footprint and solder profile affect solder quality and mechanical reliability. Evidence: Datasheet recommended land pattern and reflow profile should be followed. Explanation: Use manufacturer pad dimensions to ensure proper solder fillet.
Thermal behavior and derating rules: Temperature vs. current charts show allowable current at elevated ambient. Evidence: Datasheet thermal charts let you derive derating factors. Example: at 60°C, a 20% reduction might be necessary (1.88 A).
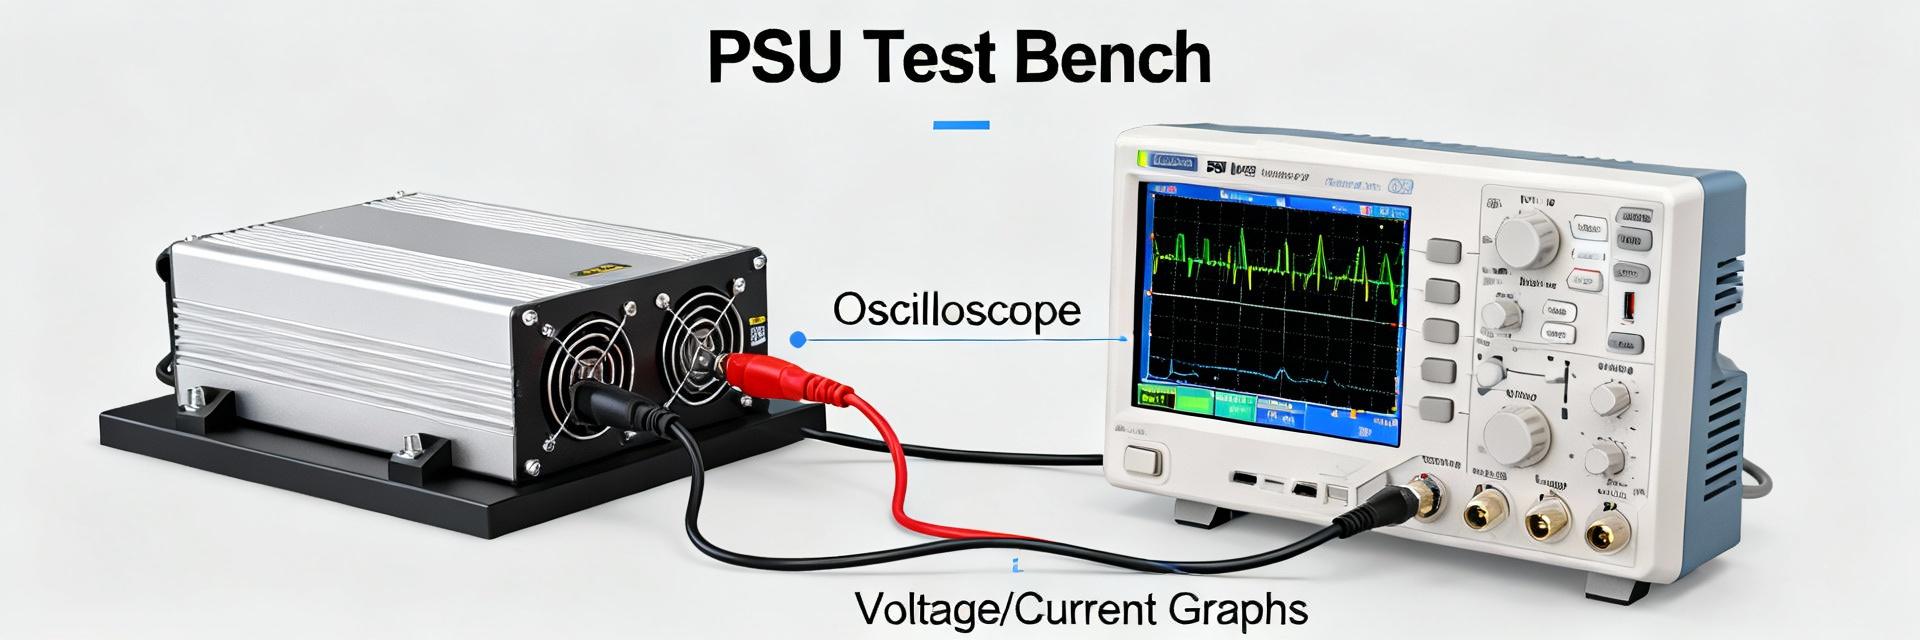
Performance Testing & Measurement Guidance
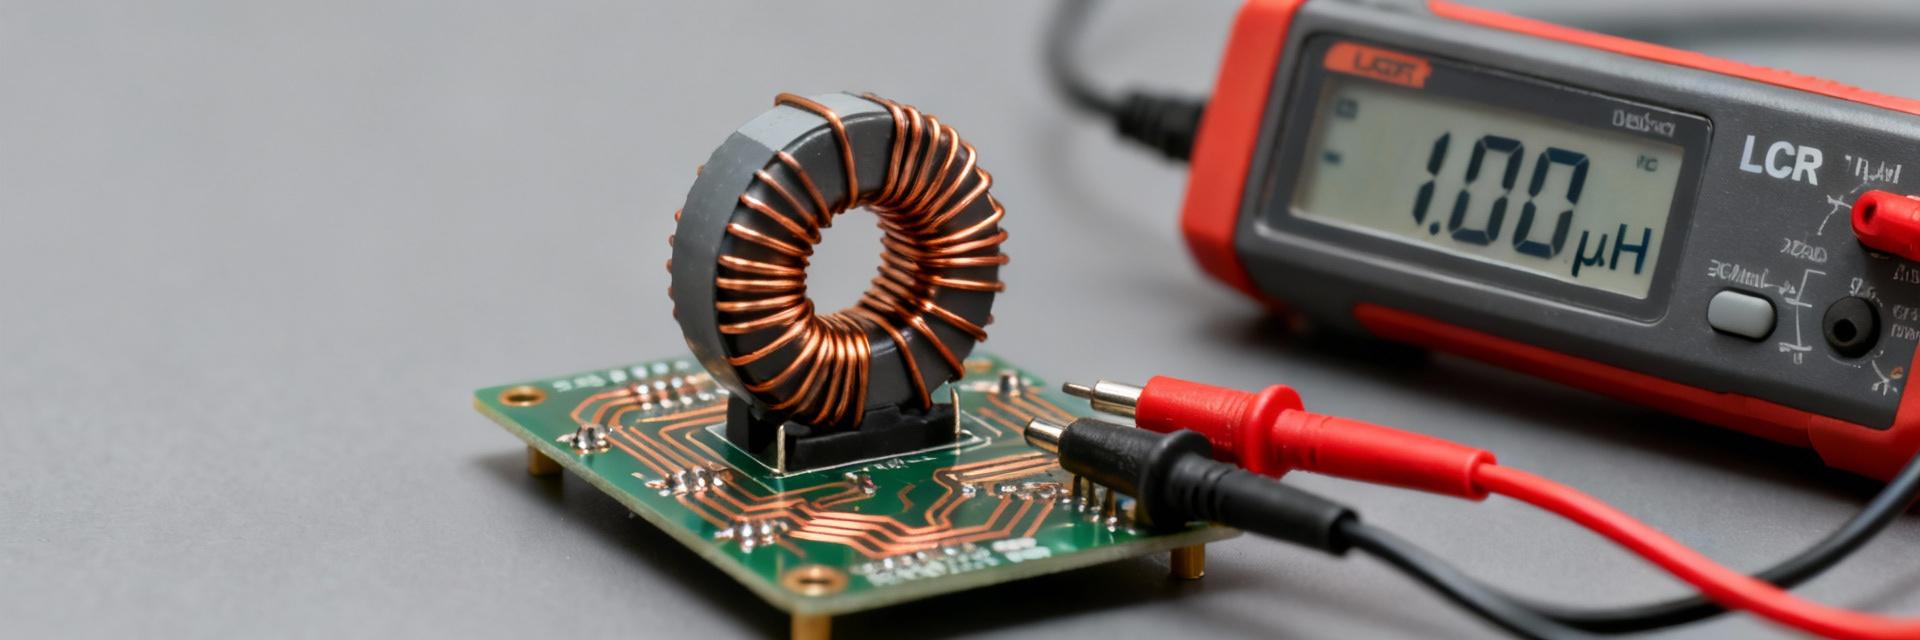
Point: Proper fixtures and settings are required to match datasheet curves. Evidence: Use a 4-wire RDC fixture and an LCR meter. Explanation: Minimize fixture inductance and keep probe loops small to ensure repeatable comparison to the datasheet.
Summary
- Watch nominal inductance and tolerance — they set filter corner frequency and margin for ripple control (use worst-case values).
- Use IR for continuous RMS thermal sizing and Isat for transient peak headroom; compute I²R losses from RDC to estimate heating.
- Derate allowable current at elevated ambient or restricted airflow — apply a conservative 20% reduction at +60°C.
- Replicate datasheet L(f) and saturation tests with proper fixtures to validate part in your switching frequency and bias conditions.
FAQ
What does the 784777047 rated current (IR) mean for my design?
IR is the continuous RMS current the part can carry with an acceptable temperature rise (usually 40K). Use IR for steady-state thermal limits. If your application has duty-cycle pulses, validate Isat separately.
How do I interpret saturation data in the 784777047 datasheet?
Saturation is where inductance drops (often defined at -30%). Design so peak currents stay below Isat to prevent inductor "shorting" behavior which can damage your switching IC.
What measurement steps reproduce the datasheet RDC and L(f) values?
Use a Kelvin (4-wire) probe for RDC to eliminate lead resistance. For L(f), use an LCR meter at the frequency specified on page 1 (typically 100 kHz or 1 MHz).