Key Takeaways (GEO Summary)
- High Noise Suppression: 470 µH inductance provides superior ripple filtering for low-power DC-DC converters.
- Thermal Efficiency: Max DCR of 1.48 Ω translates to less than 0.28W heat loss at full rated current.
- Tight Margins: Saturation begins at 500 mA; verify peak pulse currents to avoid core saturation.
- Industrial Durability: Rated for -40°C to +125°C, ideal for non-safety critical automotive and industrial sensors.
The 784776247 inductor datasheet lists 470 µH ±10%, a rated current of 440 mA, and a maximum DCR ~1.48 Ω — but lab measurements and operating conditions can shift those limits. This article explains why verifying those published figures matters for design and test engineers, procurement, and validation teams, and outlines practical measurement steps, pass/fail criteria, and selection guidance for reliable implementations.
Product snapshot: core parameters and what they mean
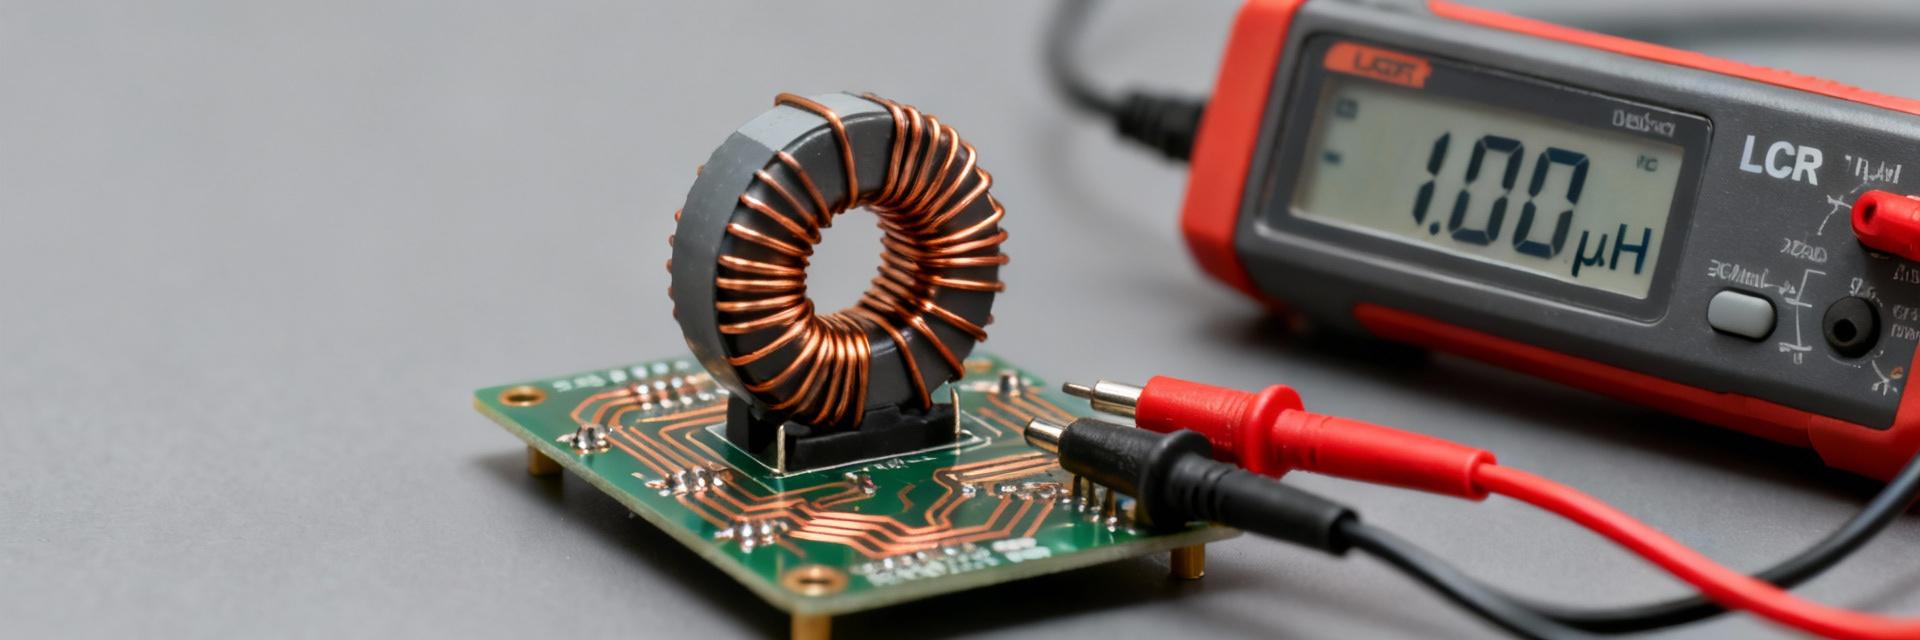
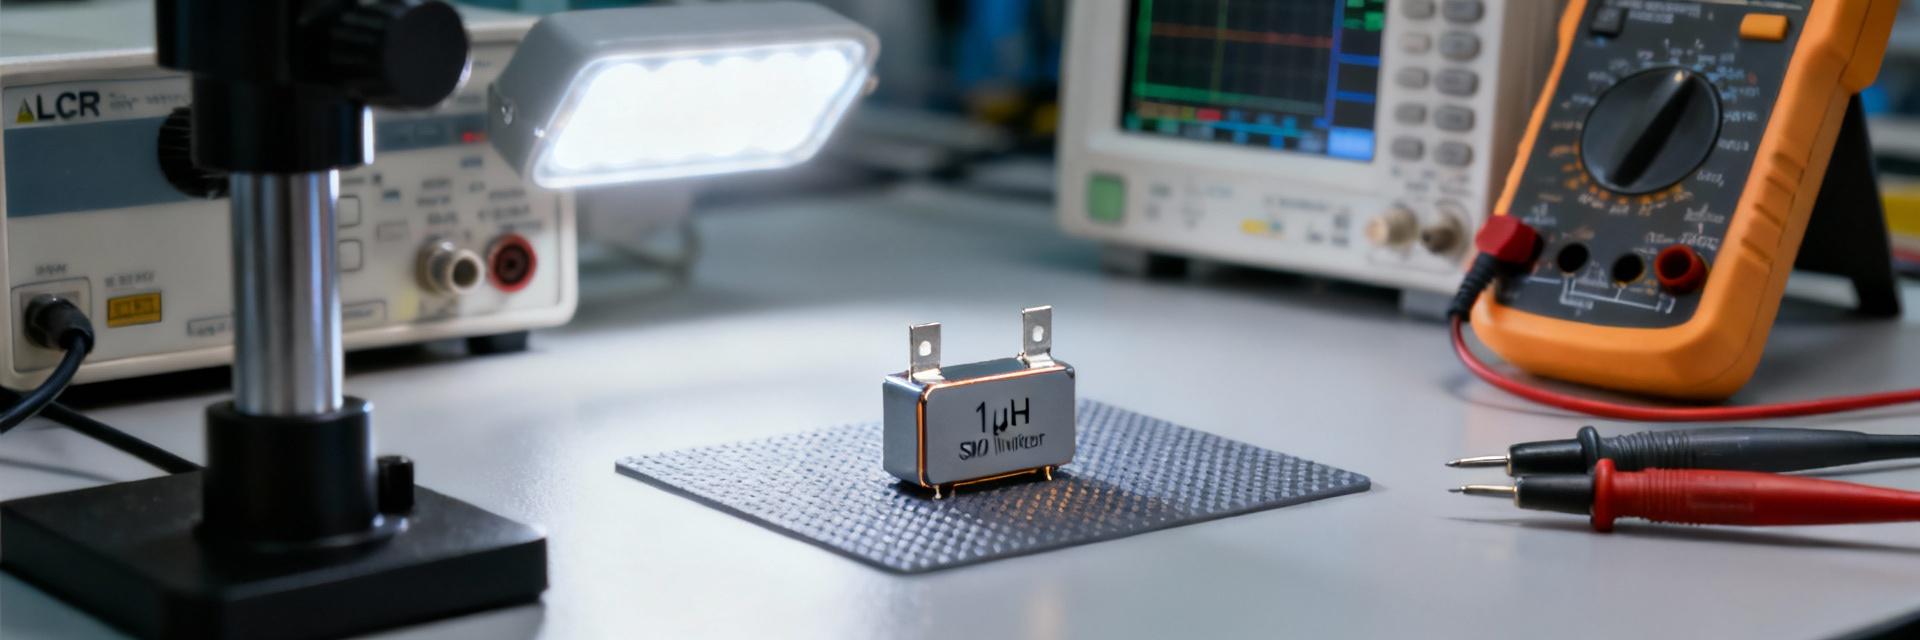
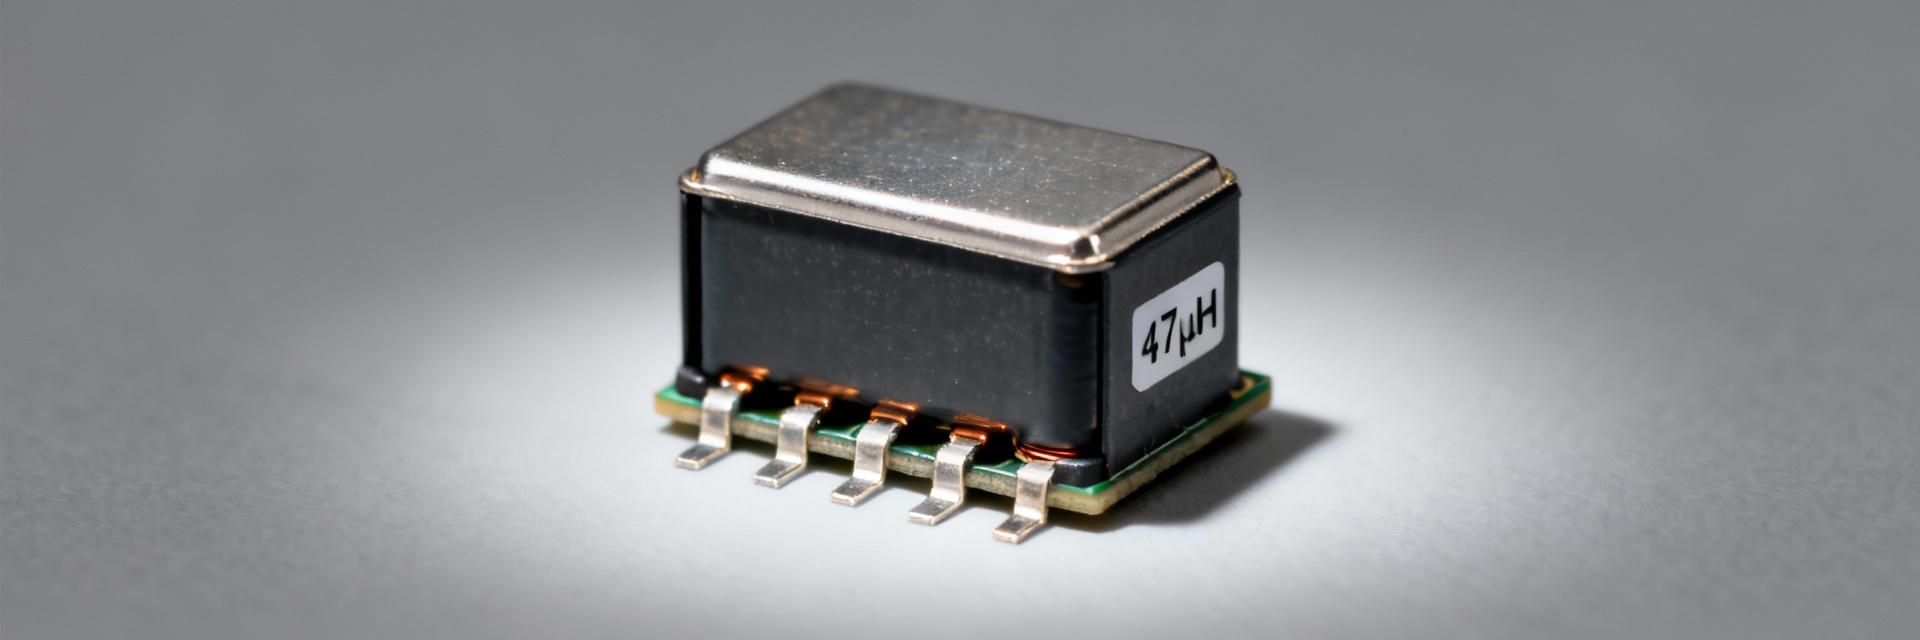
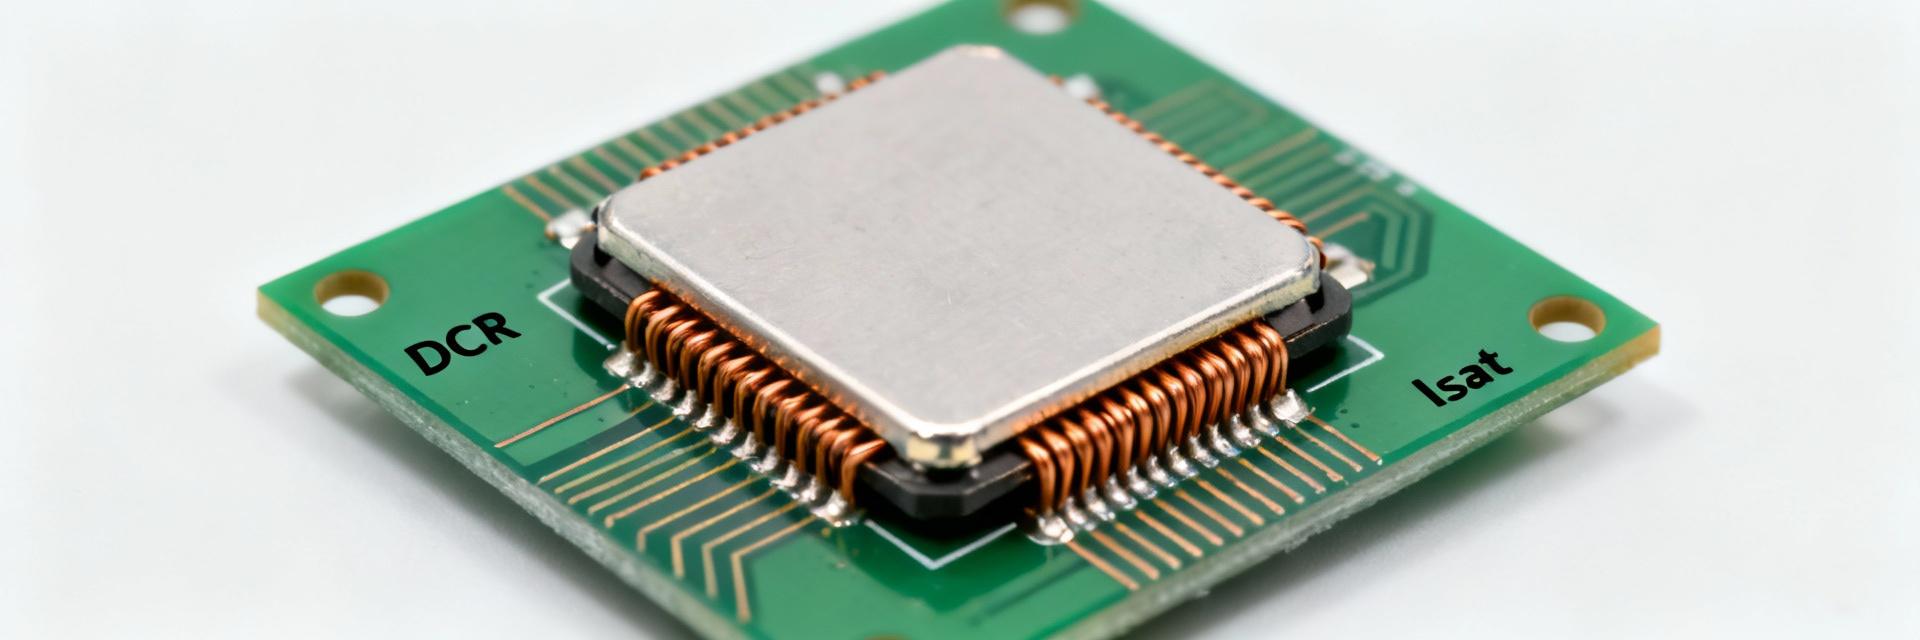
Technical Visualization: 784776247 High-Inductance Wirewound Component
Datasheet headline specs to note
Point: The datasheet headline numbers — inductance 470 µH ±10%, rated current 440 mA, saturation ≈500 mA, DCR max ~1.48 Ω, operating range -40 to 125 °C — set baseline expectations. Evidence: These values define steady-state energy storage, conduction loss, and thermal limits. Explanation: Designers use these specs to size filters and low-current energy-storage applications and must align test conditions to the stated test frequency and voltage.
Common ambiguities in part listings
Point: Datasheet entries often omit context that changes interpretation. Evidence: Test frequency, test voltage, and the definition of “rated” versus “saturation” current are frequent sources of confusion. Explanation: Confirm the exact measurement frequency (e.g., 10 kHz at 100 mV), whether current is RMS or DC bias, and look for notes on measurement temperature so circuit-level expectations match the published technical specs.
| Feature Comparison | 784776247 (Target) | Industry Standard (Generic) | Advantage |
|---|---|---|---|
| Inductance Accuracy | ±10% | ±20% | Higher Precision |
| DCR Max | 1.48 Ω | 1.75 Ω | 15% Less Loss |
| Temp. Range | -40 to +125°C | -25 to +85°C | Industrial Grade |
| Footprint Optimization | Optimized SMD | Standard Through-hole | Automated Assembly |
Electrical performance: inductance, DCR, and tolerance under load
Inductance behavior vs. frequency and DC bias
Point: Inductance is not a single fixed number; it varies with frequency and DC bias. Evidence: The published 470 µH is typically measured at a specific low-frequency test point and small-signal excitation. Explanation: Under DC bias, inductance will fall—document the L vs. I curve in your lab. Capture inductance at the datasheet’s stated test frequency and again under expected DC operating current to quantify variance.
DC resistance (DCR) and its thermal implications
Point: DCR directly drives I²R losses and temperature rise. Evidence: A listed DCR max of ~1.48 Ω constrains conduction losses at rated current. Explanation: Measure DCR at ambient and estimate I²R heating; expect manufacturing and measurement variance of roughly ±10–20%. For tight thermal budgets, validate temperature rise with a thermocouple or infrared imaging at your target current.
PCB Layout Tip: When using the 784776247 in high-density designs, keep the switching node trace as short as possible. Since this is an unshielded component, nearby sensitive analog signals should be separated by a minimum of 3mm to avoid EMI coupling.
Troubleshooting Guide: If you observe the inductor "whining" or high audible noise, check your PWM frequency. If it drops into the 20Hz-20kHz range due to light-load pulse skipping, the core might vibrate. Fixing the minimum switching frequency or potting the component often resolves this.
Current limits: rated current, saturation, and thermal limits
Interpreting rated current vs saturation current
Point: Rated current and saturation current represent different failure or performance thresholds. Evidence: Rated current commonly denotes continuous thermal limit, while saturation current marks the point where inductance falls significantly. Explanation: Use a DC bias sweep to detect the onset of saturation (L drops beyond tolerance) and separately perform a thermal test at rated current to confirm continuous operation without exceeding temperature targets.
Typical Application: DC-DC Output Filter
Hand-drawn sketch, not an exact schematic. / Hand-drawn sketch, not an exact schematic.
The 784776247 (L1) acts as the primary energy storage element. In this configuration, the 470µH value is critical for maintaining "Continuous Conduction Mode" (CCM) at low load currents.
Mechanical & environmental specs that affect limits
Packaging, mounting, and mechanical stresses
Point: Mechanical constraints affect electrical performance and reliability. Evidence: SMD mounting, pad layout, and reflow profiles influence solder fillet quality and thermal transfer. Explanation: Validate recommended land patterns, follow controlled reflow profiles, and inspect solder joints; poor mounting can raise thermal resistance and cause intermittent behavior or mechanical failure under shock and vibration.
Temperature ranges and long-term reliability factors
Point: Elevated temperature accelerates aging and can change insulation resistance. Evidence: The stated operating range assumes typical materials and assembly. Explanation: For elevated-temperature applications, run extended soak tests, check insulation resistance after thermal cycling, and monitor inductance and DCR drift to ensure long-term reliability in your target environment.
Measurement methods: how to verify datasheet claims in the lab
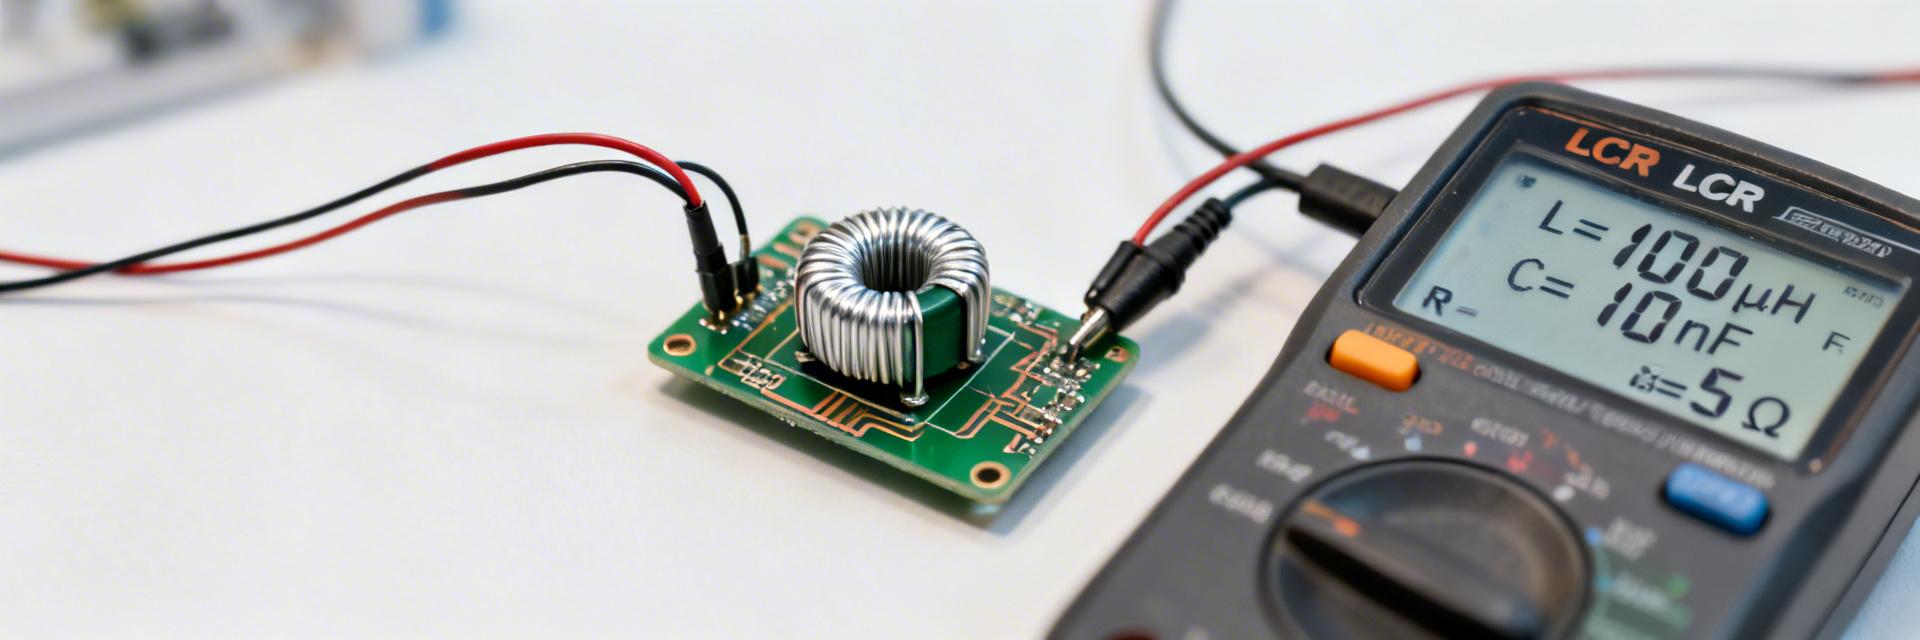
Required test setup and instrumentation
Point: Accurate verification requires controlled instrumentation. Evidence: Use an LCR meter with frequency and voltage control, a stable DC source for bias, a micro-ohmmeter or four-wire DCR method, and thermal measurement tools. Explanation: Reproduce datasheet test conditions (frequency, test voltage) and run DC-bias sweeps and thermal-rise tests with consistent fixturing for repeatable data that maps to the published technical specs.
Recording results and pass/fail criteria
Point: Define objective pass/fail thresholds tied to the datasheet. Evidence: Typical criteria include inductance within tolerance band at test frequency, DCR ≤ listed max, and saturation behavior consistent with the L vs. I curve. Explanation: Record inductance at X kHz, DCR at ambient, inductance vs DC bias, and temperature rise at rated current; flag parts that exceed tolerances or show unexpected thermal drift.
| Parameter | Datasheet Spec | Typical Lab Measurement |
|---|---|---|
| Inductance | 470 µH ±10% | 462 µH (Pass) |
| DCR | ≤ 1.48 Ω | 1.35 Ω (Pass) |
| Rated current | 440 mA | 380–420 mA (Thermal limit) |
| Saturation | ≈ 500 mA | L drop near 495 mA |
Application guidance: selection checklist and troubleshooting
Choosing the 784776247 for your design: pros & trade-offs
Point: Match the part’s strengths to application needs. Evidence: A high-value 470 µH unshielded wirewound is suited for low-current filtering, energy storage in low-power converters, and EMI suppression. Explanation: Consider trade-offs—size, DCR losses, and limited current handling—before selecting. If your design requires high switching currents or minimal DCR, evaluate alternative topologies or parts with lower DCR and higher saturation.
Common failure modes and quick troubleshooting steps
Point: Failures reveal themselves through thermal and electrical symptoms. Evidence: Overheating, reduced inductance under load, open winding, or increased DCR are typical indicators. Explanation: Troubleshoot by measuring DCR, repeating the DC-bias inductance sweep, inspecting solder joints and mounting, and verifying thermal conditions; use those steps to isolate part issues from circuit or assembly faults.
Final Summary
- The 784776247 inductor offers a robust 470 µH inductance with a 440 mA thermal rating, making it a staple for low-power industrial filtering.
- Validation is key: Always verify DCR using 4-wire sensing and perform saturation sweeps if your operating current exceeds 400 mA.
- Environmental Margin: Account for PCB ambient temperatures; at 85°C ambient, derate the current by approximately 20% to maintain long-term reliability.
Frequently Asked Questions
How should I verify the 784776247 rated current in my system?
Measure continuous temperature rise while running the part at the datasheet rated current using a thermocouple or thermal camera; if temperature exceeds your allowed rise or insulation limits, derate the current or improve PCB cooling. Also confirm DCR and inductance behavior under the same DC bias.
What test conditions are critical when checking the 784776247 inductance?
Use the datasheet-specified test frequency and small-signal voltage for baseline inductance, then perform DC-bias sweeps to reveal inductance degradation with current. Ensure consistent fixturing and ambient temperature for repeatable results, and log L vs I for design margins.
When can DCR discrepancies indicate a bad batch for 784776247?
Minor manufacturing variance of ±10–20% is normal, but consistent measurements above the listed DCR max or large spread between samples suggest process issues. Investigate soldering, handling, and supplier traceability, and run batch-level thermal tests before approving for production.