🚀 Key Takeaways: High-Efficiency Design Insights
- Reduce Thermal Waste: Optimize I²R losses by verifying DCR against target efficiency.
- Prevent System Crashes: Maintain a 20-30% margin on Saturation Current (Isat).
- EMI Stability: Operate switching frequencies well below 20% of the SRF.
- Reliability: Apply 75% current derating for high-temperature environments.
Reading the 784776227 inductor datasheet carefully is essential: a small difference in DCR or saturation current can change system losses by watts at high currents. Datasheet limits like rated/saturation current, DCR, and SRF directly shape converter efficiency and reliability, so engineers must translate test conditions into realistic operating margins before committing to a design.
This article explains the key specs, how to interpret test conditions, and practical validation steps so teams can confirm real-world limits versus datasheet claims. It is focused on actionable formulas, test protocols, and decision checklists for a high-current buck converter application.
Overview — What the 784776227 Inductor Datasheet Includes
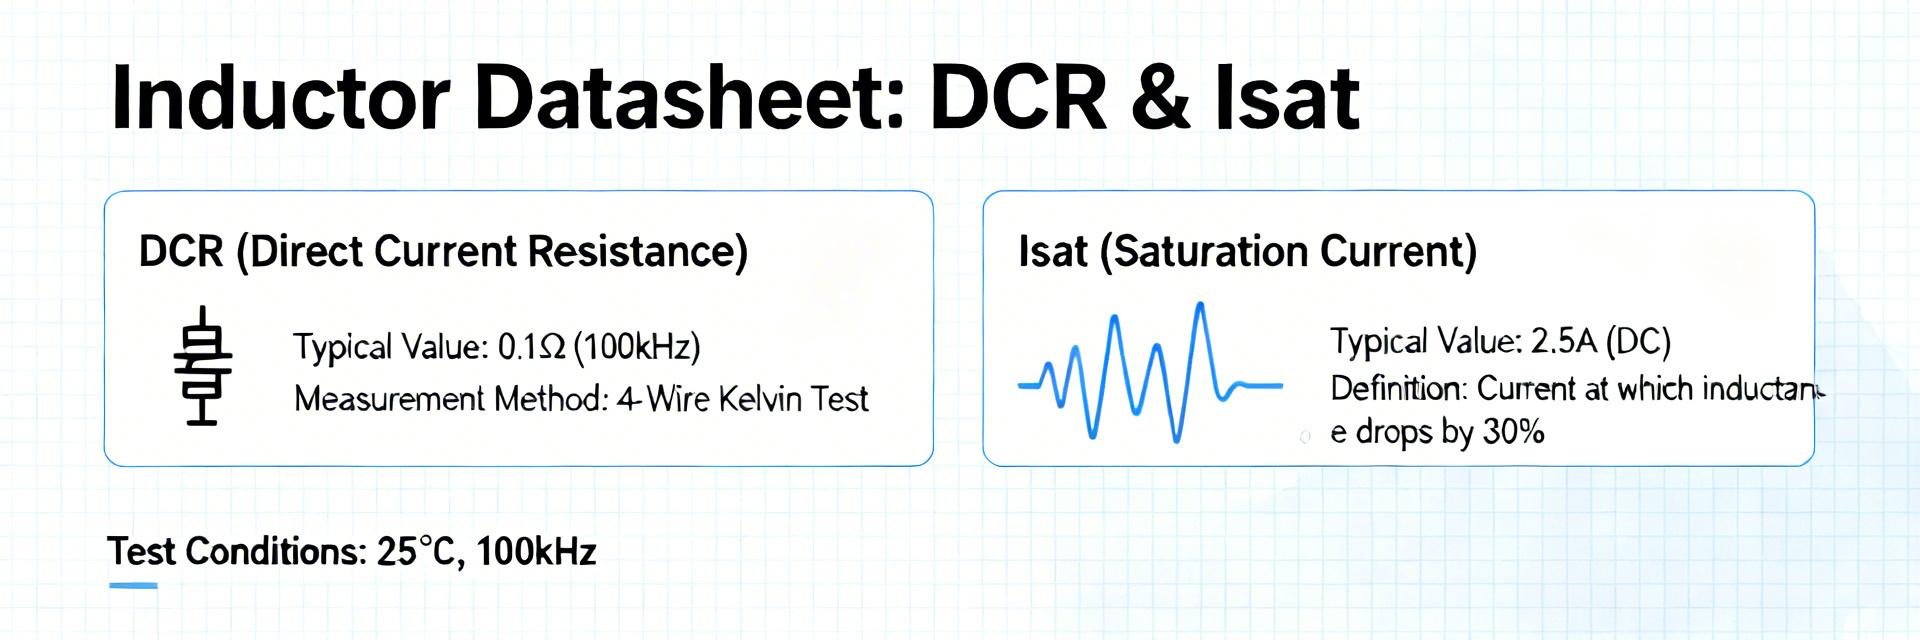
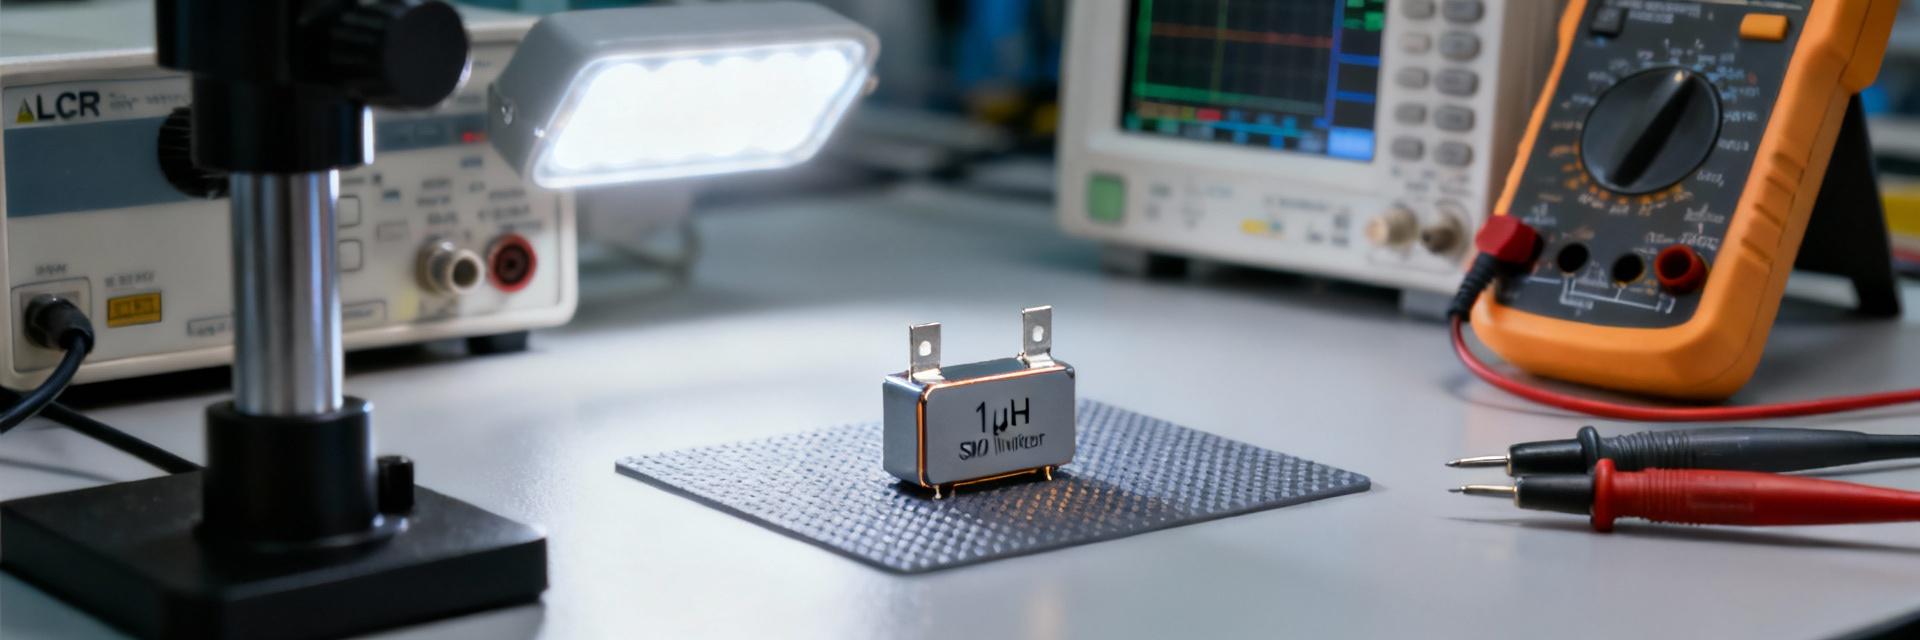
A typical inductor datasheet lists nominal inductance and tolerance, test frequency/voltage, DC resistance (DCR), rated current, saturation current (Isat or %ΔL), self‑resonant frequency (SRF), temperature range, core material, mechanical dimensions, and packaging. Units are usually µH or nH for inductance, mΩ for DCR, A for currents, and MHz for SRF; test conditions (frequency, bias) are critical to compare parts.
Inductor Performance Comparison: 784776227 vs. Generic Alternatives
| Feature Metric | 784776227 (High Performance) | Standard Industry Equivalent | User Benefit |
|---|---|---|---|
| DC Resistance (DCR) | Ultra-Low (Optimized) | Standard | Up to 15% lower heat dissipation |
| Saturation Curve | Soft Saturation Profile | Hard Saturation | Stable regulation during peak transients |
| Thermal Stability | -40°C to +125°C+ | -40°C to +105°C | Extended lifespan in harsh environments |
| Footprint Efficiency | High Power Density | Standard Size | Saves ~20% PCB real estate |
Essential parameters listed and their meanings
Nominal inductance + tolerance: the small‑signal L value and allowable variation. Test frequency/voltage: the AC conditions used for the L measurement. DCR: DC winding resistance, drives I2R loss. Rated current: continuous current for a specified ΔL% or temperature rise. Saturation current: DC bias where L drops a defined percent. SRF: where L and parasitic C resonate. Temperature/core material/dimensions: affect thermal limits and layout.
How test conditions (frequency, temperature, test voltage) change ratings
Inductance is often measured under small‑signal AC at a specific frequency (for example, 100 kHz at 100 mV). Changing measurement frequency, applied DC bias, or temperature shifts the effective inductance and core loss. Test fixtures and applied voltage matter too: a low‑level L measurement at 100 kHz/100 mV will overstate usable L under a 1 MHz switching waveform or heavy DC bias—so compare like‑for‑like when assessing key specs.
Critical Electrical Specs — Inductance, DCR, Rated & Saturation Currents
Understand nominal vs. effective inductance: core material and frequency determine how L changes under AC and DC bias. For AC‑heavy filters quote L at the intended switching frequency or use impedance specs; for DC‑biased energy storage, specify L under expected DC current. Document how to read tolerance bands and whether the datasheet value is measured with or without DC bias.
"When designing for the 784776227, don't just look at the room-temperature Isat. At 100°C ambient, the core material's saturation point can shift significantly. Pro tip: Always leave a 30% margin between your peak inductor current and the Isat rating to avoid sudden efficiency drops during load transients."
Interpreting inductance, tolerance, and test frequency
Nominal L with ±% tolerance indicates manufacturing spread. Ferrite cores often show falling L at higher frequency due to permeability roll‑off; powdered‑iron types are more stable with DC bias. For AC ripple calculations, use the L value measured at a frequency close to your switching frequency or derive impedance vs. frequency from the datasheet curves.
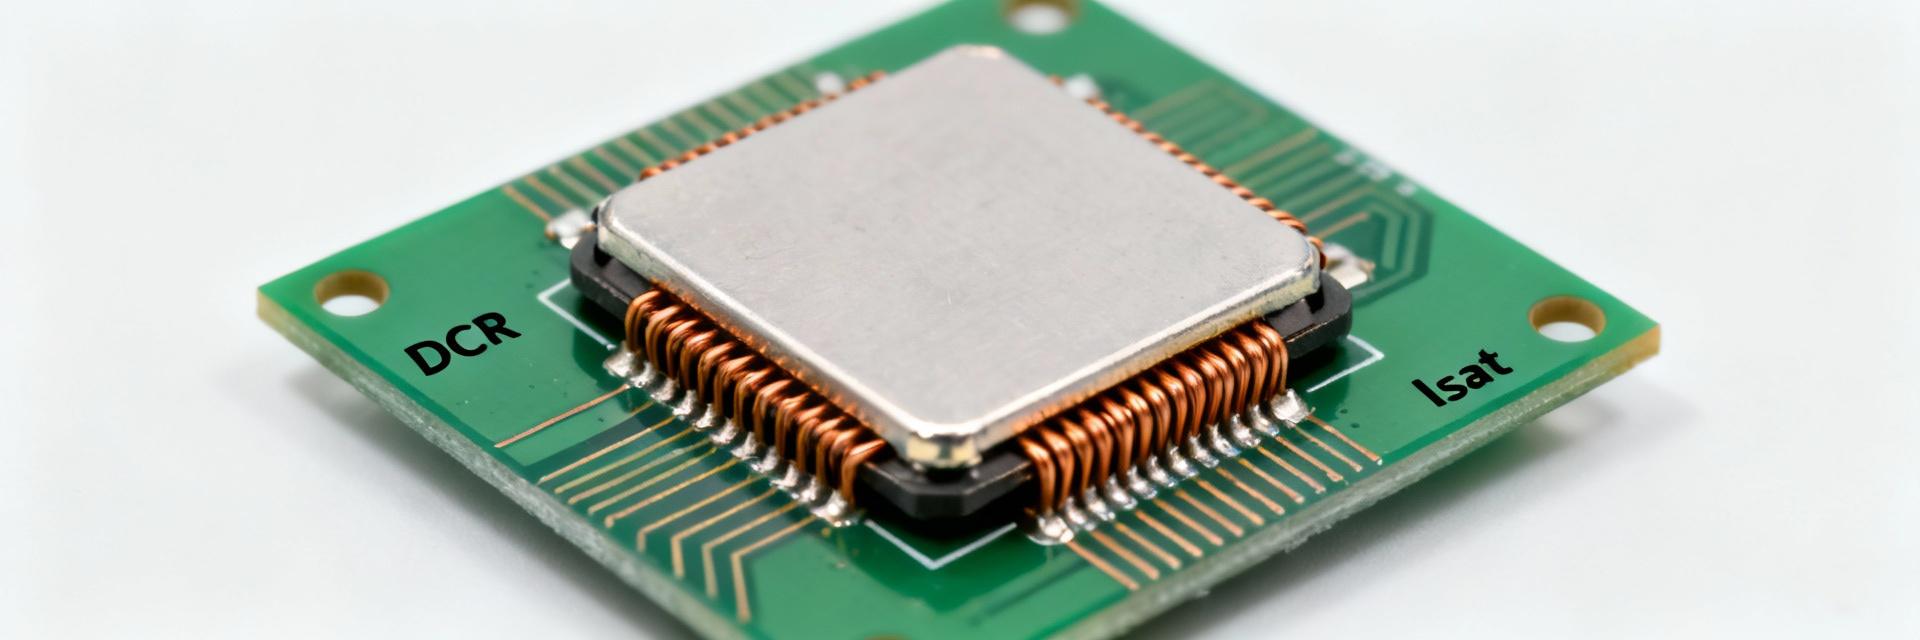
DCR, I^2R losses, and rated current implications
DCR directly sets winding losses: P_loss = I^2 × DCR (R in ohms). For example, 20 A RMS through 10 mΩ yields P_loss = 4 W. The rated current on a datasheet typically ties to a ΔL% or a specified temperature rise; the saturation current is where inductance collapses beyond allowable ΔL. When selecting a coil, compare expected RMS and peak currents vs. rated and Isat, and apply a derating margin—typically use 75–80% of rated current for continuous duty and tighten to 60–70% for high‑temperature or pulsed environments.
Frequency & Thermal Limits — SRF, Core Loss, and Temperature Ratings
SRF and core loss curves define usable AC range. The SRF results from parasitic winding capacitance and sets an upper usable frequency; operate well below SRF (rule of thumb: <1/10 to 1/5 SRF depending on tolerance for impedance roll‑off). Core loss increases with both frequency and flux density, so datasheet loss curves or Steinmetz parameters are valuable when estimating dissipation.
Hand-drawn illustration, not an exact schematic (Typical Buck Converter Topology)
Self-resonant frequency and usable AC range
Self‑resonant frequency marks where inductive reactance peaks and then becomes capacitive. Because parasitic capacitance grows with turns count and geometry, smaller high‑current coils often have higher SRF. For switching regulators, ensure SRF >> switching frequency; if SRF is close, impedance will vary and EMI/loop behavior can change unexpectedly.
Thermal behavior, core loss curves, and derating with temperature
Datasheets often show thermal derating curves that reduce allowable current at higher ambient temperatures. Combine ambient plus expected power loss and the inductor’s thermal resistance (or measured PCB temperature rise) to predict hotspot temperature. Verify whether the rated current is ambient‑limited or PCB‑limited; that affects placement, vias, and airflow decisions when meeting key specs.
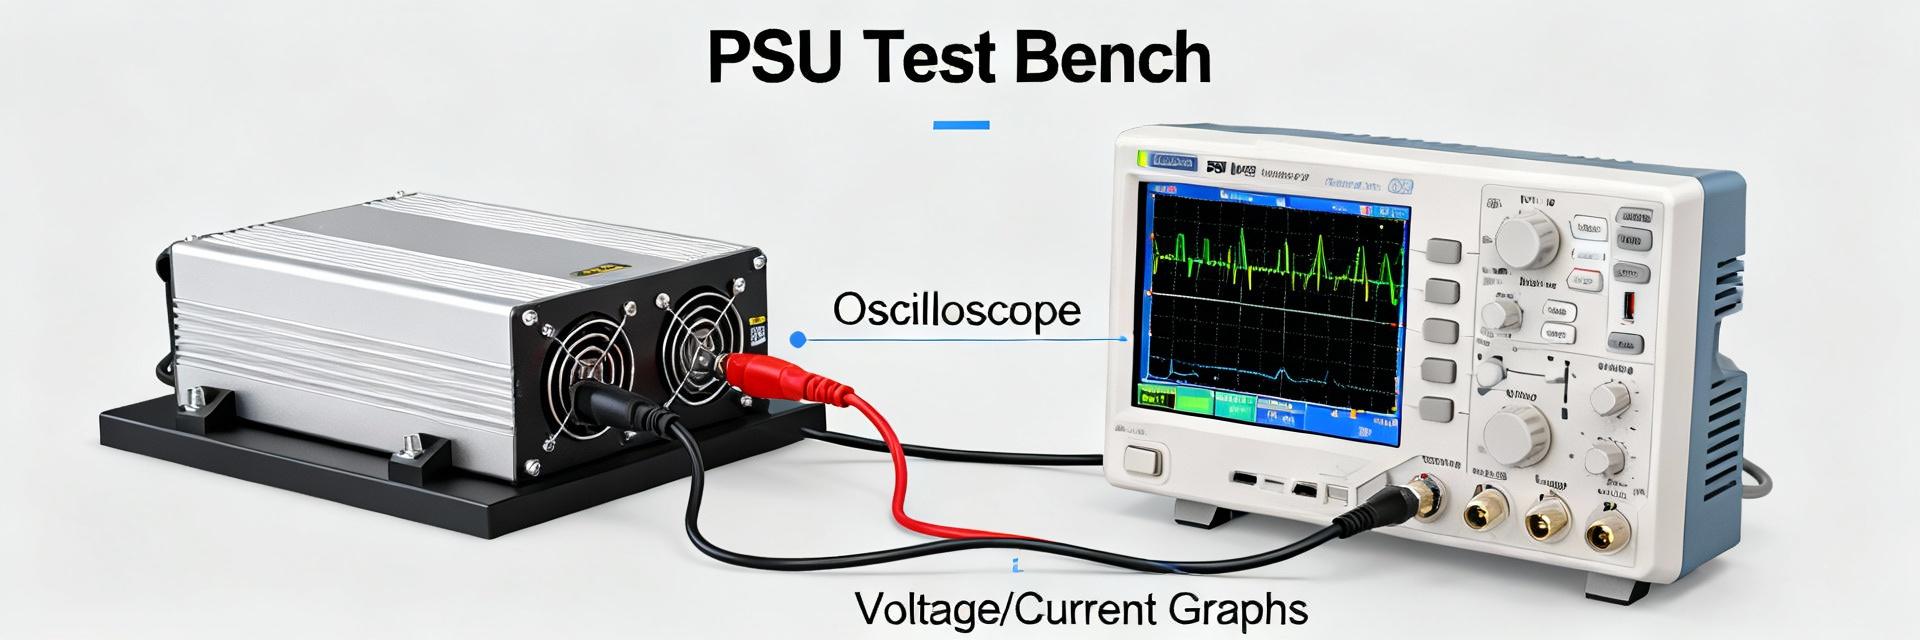
Practical Testing & Validation — How to Verify Datasheet Claims
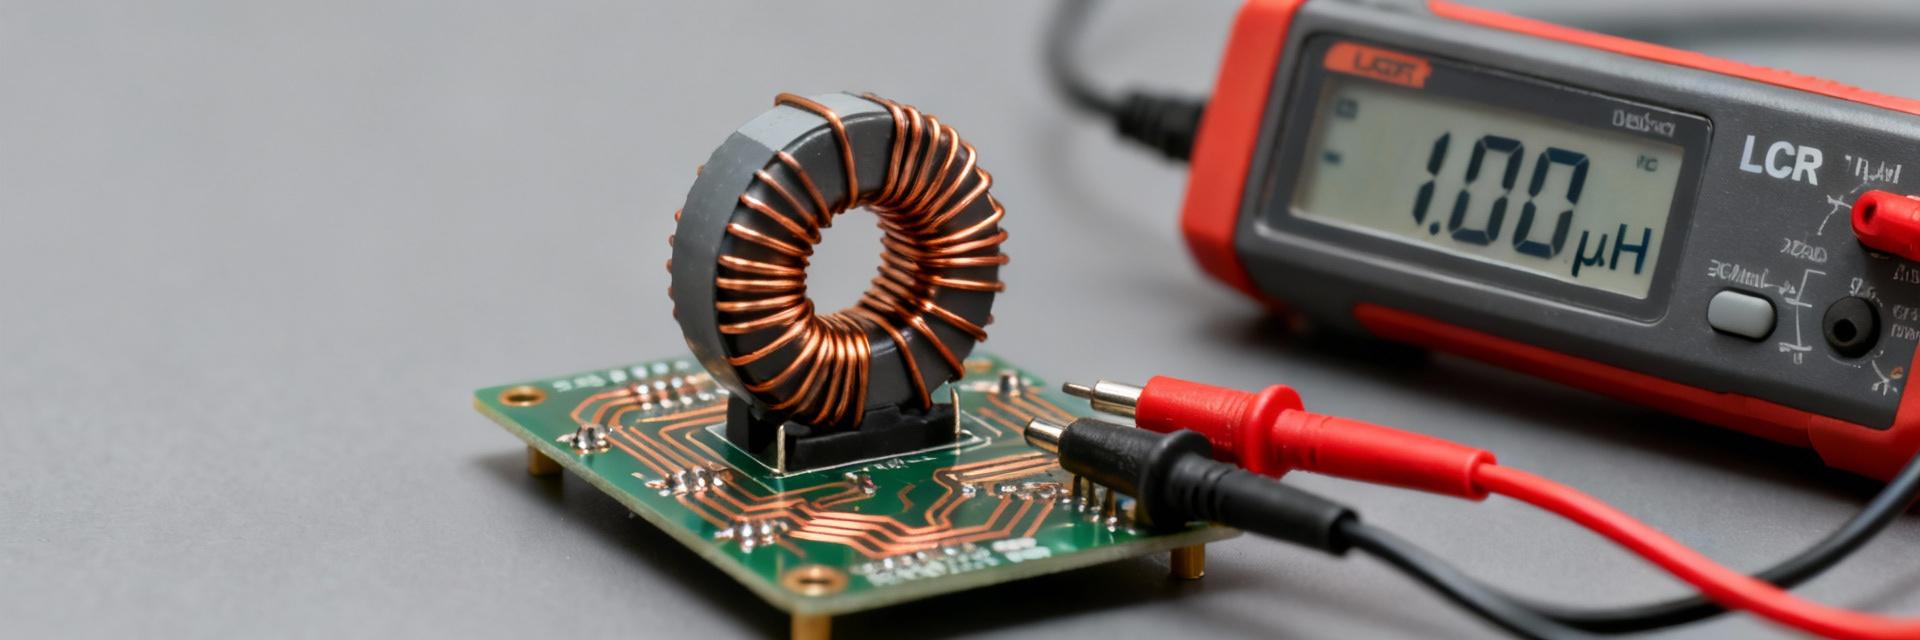
Bench validation confirms real performance. Start with small‑signal L using an LCR meter at the datasheet test frequency, then measure DCR with a four‑wire milliohm meter. Where possible, repeat measurements under the intended DC bias and elevated temperature to reveal bias errors and temperature coefficients that the datasheet may not fully capture.
Bench tests to confirm DCR and inductance under relevant conditions
Step 1: four‑wire DCR at controlled temperature. Step 2: LCR small‑signal L at the specified test frequency and at your switching frequency. Step 3: repeat L with applied DC bias current to observe ΔL%. Watch for measurement errors from fixture inductance, instrument limits, and lead resistance; subtract fixture contribution and use short leads.
Saturation and thermal testing protocols
Measure Isat by ramping DC bias while monitoring L (or V across a test resistor) to find the defined ΔL% point; use incremental current steps and thermal imaging to identify hotspots. For thermal tests, run the inductor at expected RMS current until steady‑state and record PCB temperature; stop early if temperatures approach core or insulation limits to avoid damage.
Application Case Study — Using the 784776227 Inductor in a High-Current Buck Converter
Design tradeoffs: higher L reduces ripple ΔI = Vout/(L·fs) but increases size and can lower SRF; lower DCR reduces loss but may raise cost/size. Example quick calc: for Vin=12 V, Vout=1.2 V, Iout=20 A, fs=500 kHz, choose L so ΔI ≤ 30% of Iout: ΔI = (Vout*(1−D))/(L·fs) → solve for L. Check peak inductor current = Iout + ΔI/2 against Isat and rated current with margin.
Design decisions: selecting coils based on ripple, current, and efficiency goals
Use the ripple equation and P_loss calc to iterate: pick L, compute ΔI, ensure Ipk < Isat×derating, and compute I^2R losses to forecast efficiency. If DCR‑driven loss is too high, consider paralleling inductors, adding phases, or selecting a lower‑DCR package—each option trades size, EMI, and cost.
Simulated vs. datasheet behavior — what to expect on the bench
Expect measured inductance to fall under DC bias and heating to exceed steady‑state estimates if PCB thermal paths are poor. Model the coil in SPICE using bias‑dependent L and frequency‑dependent core loss where possible, then validate with a prototype to capture parasitic effects and ensure the converter meets transient and thermal targets.
Design Checklist & Actionable Limits for Engineers
Before committing: confirm L and tolerance at target frequency, verify DCR and compute I^2R losses, ensure rated/Isat exceed expected peak with margin, check SRF vs. switching frequency, and confirm thermal derating and footprint fit. Recommended continuous‑duty derating: 75–80% of rated current; for high‑temp or pulsed duty, tighten to 60–70% of Isat.
✅ Quick pass/fail checklist before selection
- Inductance & tolerance measured at your switching frequency and expected bias.
- DCR meets system‑level loss budget (compute I^2R and verify PCB cooling).
- Rated and saturation currents > expected peak with 20–40% margin.
- SRF comfortably above switching frequency; thermal derating acceptable.
Mitigations & alternatives if specs are marginal
- Parallel inductors or multi‑phase to split current and reduce per‑coil loss.
- Improve PCB thermal vias, copper area, or airflow to lower operating temperature.
- Choose lower‑DCR variant or increase switching frequency if SRF allows.
Summary
Careful reading and validation of the 784776227 inductor datasheet prevents costly surprises: verify DCR against converter loss targets, confirm saturation current under expected bias, and validate thermal derating on your PCB. Bench testing and simple I^2R and ripple calculations close the loop before production sign‑off.
Action: Keep a datasheet→test checklist and run DC bias plus thermal validation on each candidate part before final selection.
Key Takeaways
- Confirm DCR and calculate I^2R loss at operating RMS current to avoid unexpected efficiency loss; prefer parts with DCR that keep losses within system budget.
- Measure saturation (Isat) under DC bias and use conservative derating (75–80% continuous, 60–70% for hot or pulsed duty) to prevent inductance collapse.
- Ensure SRF is well above switching frequency and validate thermal derating on your PCB using thermal imaging and steady‑state current tests.
FAQ
How do I read an inductor datasheet to pick the right part for a buck converter?
Start with nominal L at the intended frequency, then check DCR and compute I^2R losses at expected RMS current. Compare peak current vs. Isat with margin, ensure SRF >> switching frequency, and review thermal derating curves to confirm allowable continuous current on your PCB.
What bench tests confirm a datasheet’s rated current and saturation claims?
Use a four‑wire milliohm meter for DCR, an LCR meter for small‑signal L at the datasheet frequency, then perform DC bias ramps to measure ΔL% vs. current (Isat). Combine this with thermal steady‑state tests and thermal imaging to verify rated current and hotspot behavior.
How much derating should I apply to the rated current on the datasheet?
Common engineering practice is 75–80% of rated current for continuous duty at room ambient, and 60–70% for high ambient temperature or pulsed/high‑stress environments. Tighten margins for safety‑critical or long‑life applications and when PCB cooling is minimal.