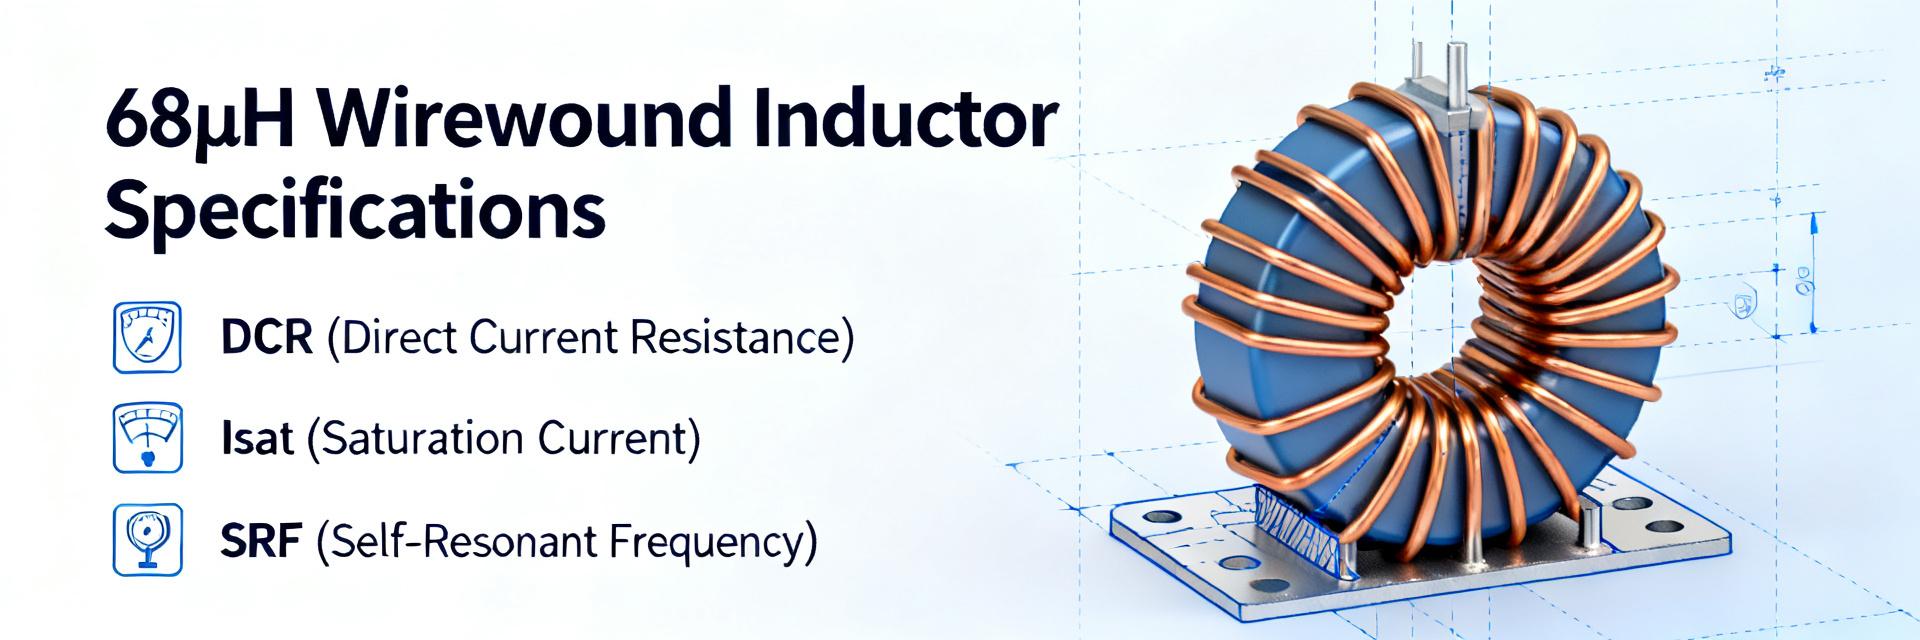
In common power-filter and low-frequency choke roles, 68 µH wirewound inductors commonly exhibit DC resistance (DCR) from tens to low hundreds of milliohms, saturation currents in the hundreds of milliamps to several amps, and Q-factor behavior that determines suitability for DC‑DC, EMI filtering, and audio circuits. This short, data-driven snapshot summarizes the typical ranges engineers will see, and sets expectations for bench verification and BOM comparison.
This report gives a concise, testable performance summary and a datasheet-oriented checklist you can apply straight to lab work. It focuses on measurable metrics, pass/fail guidance, and practical notes so you can validate inductor performance against a parts datasheet and decide whether a part meets your circuit’s thermal, current, and frequency requirements.
1 — Component overview: specs that matter (Background)
1.1 Key electrical specs to list
Point: For a compact performance summary capture these primary datasheet values: nominal inductance with tolerance and test frequency; DC resistance (DCR); rated and saturation current (Irms, Isat); self‑resonant frequency (SRF); Q factor at target frequency; temperature coefficient and insulation/voltage rating; physical size and terminal style. Evidence: these items determine losses, thermal rise, and frequency limits. Explanation: when you record a component’s datasheet, list the nominal 68 µH figure, test frequency for L, DCR in milliohms, Isat where L falls by specified %, SRF, and Q to compare against measured performance.
1.2 Typical application contexts & performance drivers
Point: Typical uses include power chokes for DC‑DC converters, EMI filters, and low‑frequency audio stages. Evidence: power applications prioritize low DCR and high Isat; EMI and filter roles prioritize SRF and Q. Explanation: choose parts based on the dominant driver—minimize copper loss for power, maximize impedance in the filter band for EMI, and favor stable inductance and low audible noise for audio.
2 — Datasheet data analysis: what numbers imply (Data analysis)
2.1 Interpreting DCR, Isat and thermal limits
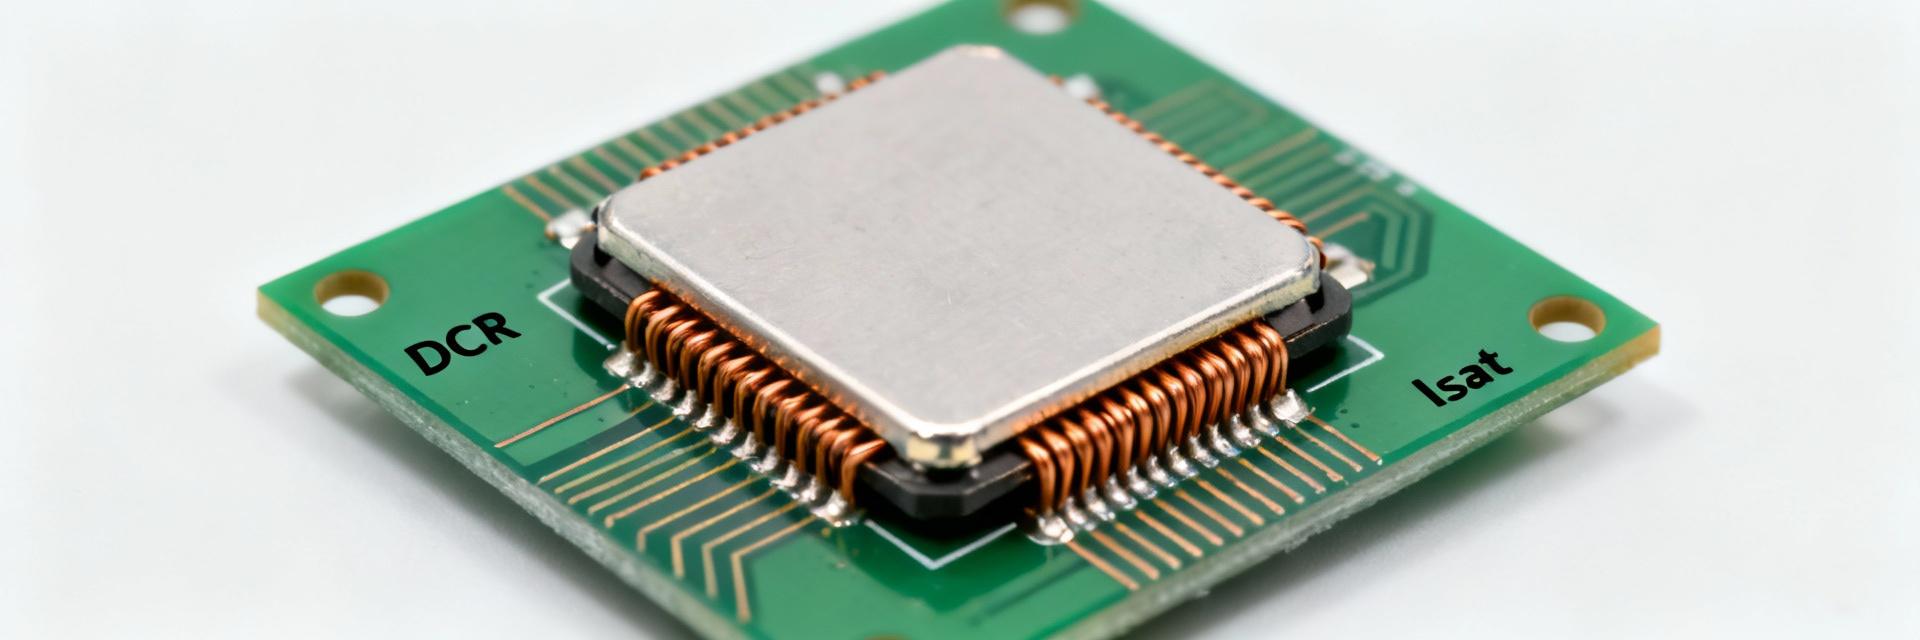
Point: DCR maps directly to copper loss and continuous heating; Isat and Irms guide usable current range. Evidence: DCR × I^2 gives steady‑state copper loss; Isat is usually specified as the DC current producing a defined percent inductance drop (often 10–30%). Explanation: treat Isat as the hard limit for energy‑storage roles; use Irms and thermal curves for continuous operation. If a datasheet provides a thermal derating curve, apply the curve to expected ambient and enclosure conditions—expect sizable derating approaching the component’s temperature limit, and design with margin.
2.2 Frequency behavior: SRF, Q-factor and impedance curve
Point: Inductance, impedance and Q vary with frequency; parts lose inductive behavior near SRF. Evidence: below SRF, impedance rises with frequency; near SRF, measured L falls as parasitic C dominates. Explanation: use impedance vs. frequency plots to verify suitability—if your operating band approaches SRF expect reduced inductance and lower Q. For filter design, ensure SRF lies above the highest significant harmonic so the part behaves inductively in the band of interest.
3 — Practical performance checks (Methods / Test guide)
3.1 Recommended bench tests & equipment
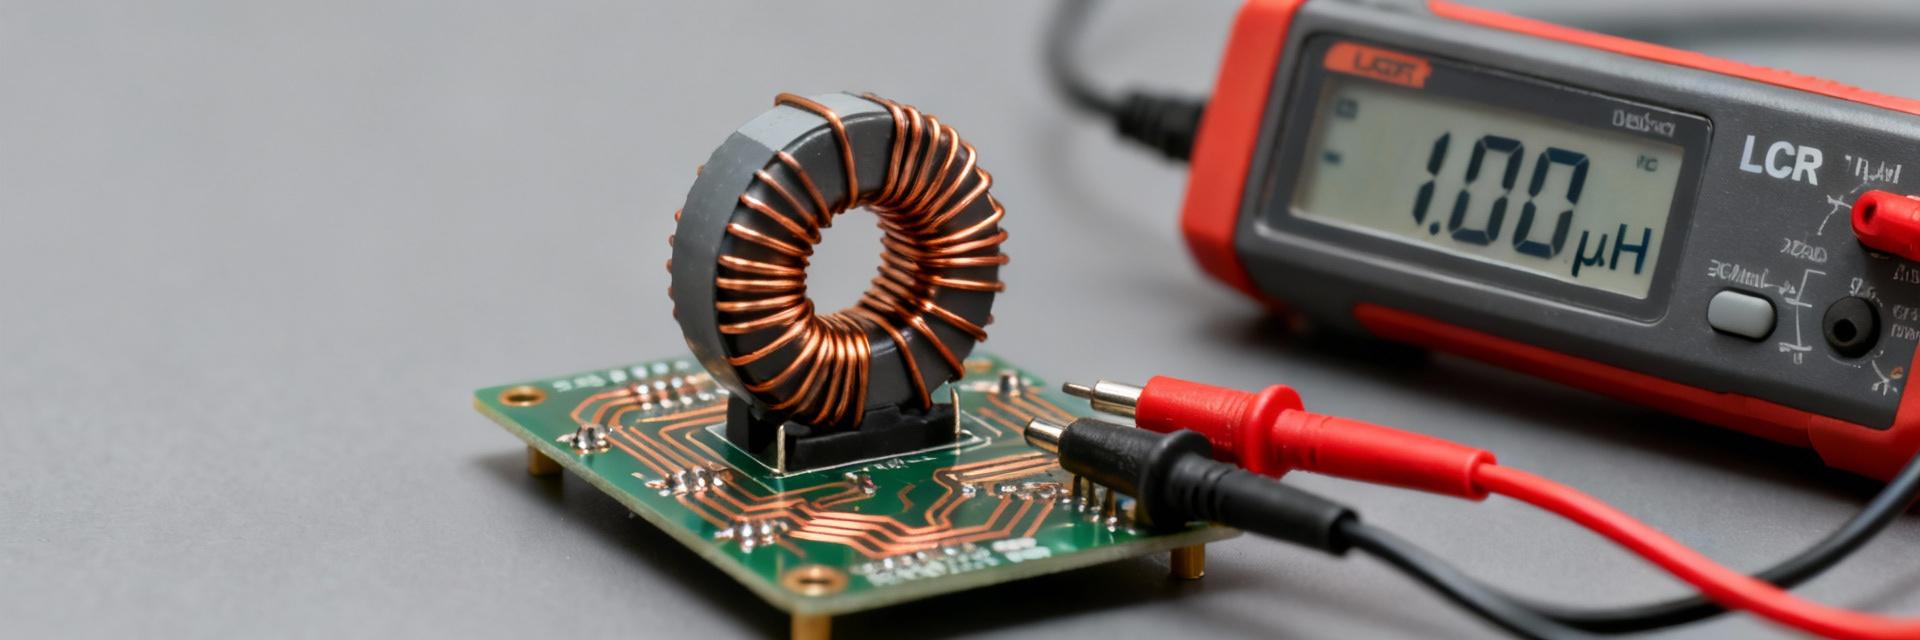
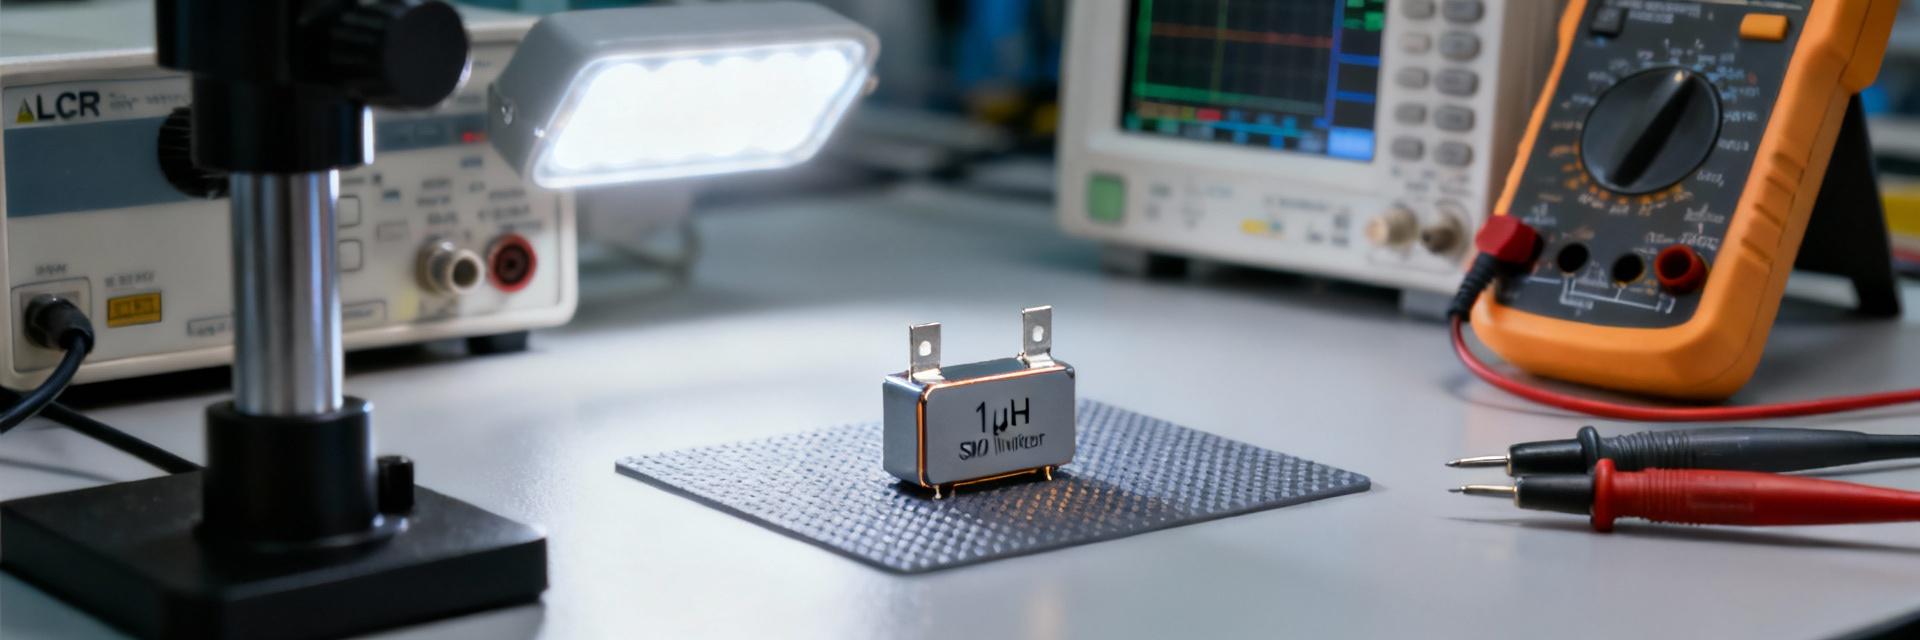
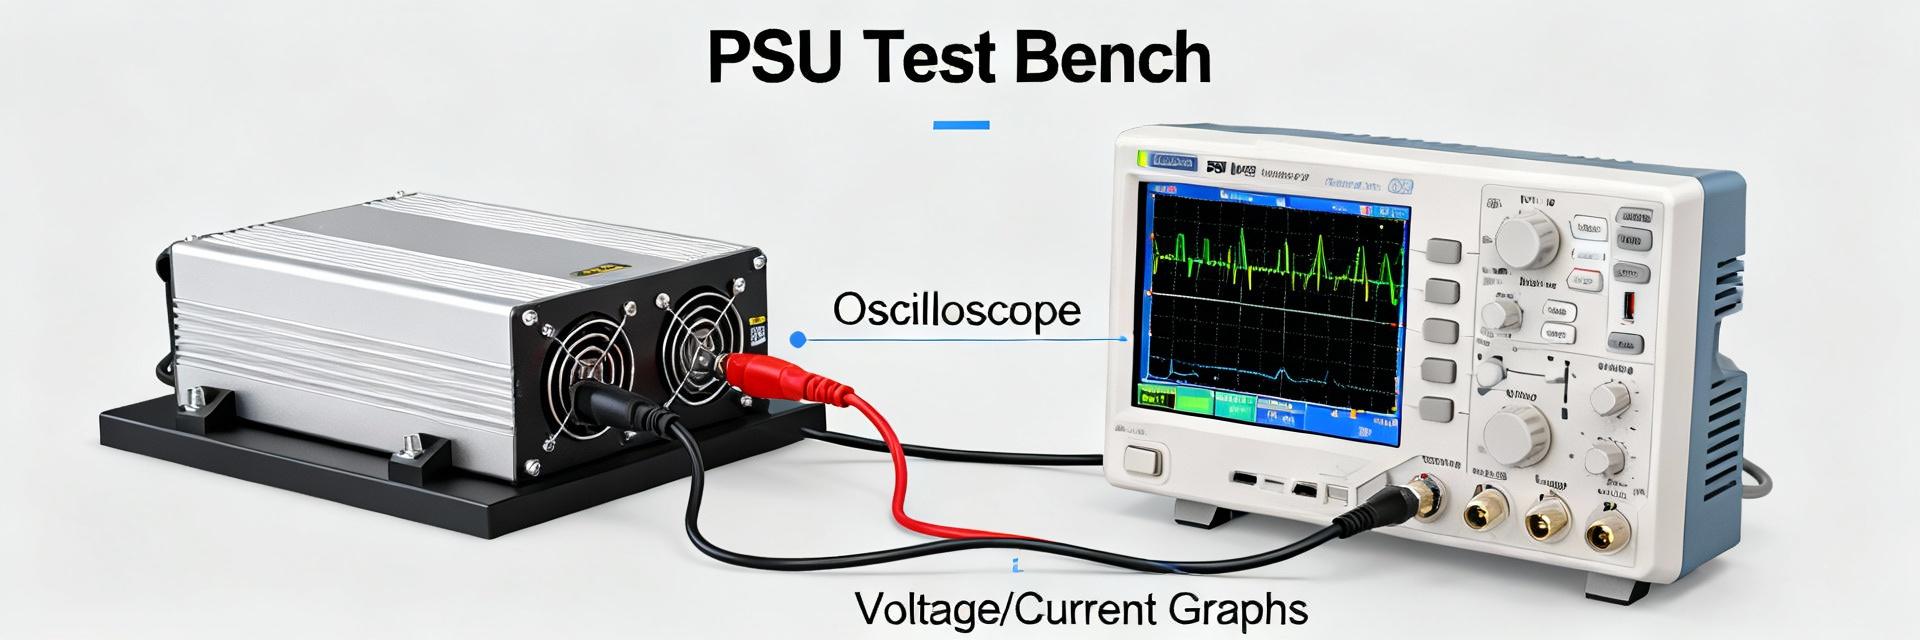
Point: Essential tests: four‑wire DCR, inductance at relevant frequencies, impedance sweep, saturation current test, and thermal‑rise measurement. Evidence: a 4‑wire ohm meter removes lead resistance; LCR meters at the target frequency report L and Q; an impedance analyzer or VNA gives a full impedance vs frequency trace. Explanation: for saturation run a controlled DC current ramp while measuring L until the specified percent drop; for thermal rise apply continuous current equal to expected Irms and measure temperature after steady state. Always reference the datasheet for test limits and acceptance criteria.
3.2 Interpreting test results vs. datasheet claims
Point: Deviations arise from tolerance, fixture effects, and temperature. Evidence: typical inductance tolerance can be ±10–20%; measurement fixtures add series resistance and stray inductance. Explanation: report deltas as both percent and absolute values (e.g., measured L = 63.5 µH, −6.8% vs nominal). If DCR is higher than datasheet, confirm 4‑wire setup and retest; if saturation occurs early, increase Isat margin or select a different part.
4 — Representative performance summary (Case / example data-driven snapshot)
4.1 Example summary table
| Parameter | Nominal / Tolerance | Typical Measured | Pass Criteria |
|---|---|---|---|
| Inductance (@ test freq) | 68 µH ±10% (@ 100 kHz) | 63–74 µH | Within tolerance |
| DCR | 40–200 mΩ | Measured with 4‑wire | ≤ datasheet + 10% |
| Isat (L drop 20%) | 0.3–3.0 A | Measured via current ramp | ≥ design peak × 1.2 |
| SRF | > 1 MHz typical | Impedance curve peak | SRF > operating band |
| Q @ target freq | Varies | Measured with LCR | As required by filter spec |
4.2 Common failure modes observed
Point: Typical issues include excessive DCR drift, early saturation, insulation breakdown with high temperature, and resonance anomalies from stray capacitance. Evidence: these manifest as unexpected heating, loss of inductance under load, or spurious peaks in impedance plots. Explanation: troubleshoot by repeating tests across fixtures, checking solder/terminals, and running thermal cycling to confirm degradation mode.
5 — Selection & implementation checklist (Actionable recommendations)
5.1 How to choose the right 68 µH wirewound inductor for your circuit
Point: Use a stepwise checklist: define operating current and frequency, verify DCR and thermal specs, confirm SRF above the highest harmonic, ensure footprint fit, and require measured validation. Evidence: select Isat ≥ 1.2–1.5× expected peak current and Irms rating matching continuous current. Explanation: when comparing parts, produce a short datasheet comparison sheet listing measured L, DCR, Isat, SRF and thermal rise; prefer parts with lower DCR for power conversion and higher SRF for filter applications.
5.2 PCB layout & thermal considerations
Point: Layout materially affects inductor performance via copper heatsinking and stray coupling. Evidence: increasing copper area under the part reduces thermal resistance; nearby traces or magnetic components can introduce coupling. Explanation: provide copper pours for thermal dissipation, keep sensitive nodes clear of the inductor’s magnetic field, and maintain airflow paths for elevated continuous currents.
Summary
Concise restatement: match datasheet numbers to bench measurements focusing on DCR, Isat/Irms, SRF, and Q. Practical checklist: run 4‑wire DCR, LCR single‑frequency, impedance sweep, saturation ramp, and thermal rise tests and record deltas against the datasheet. Use margins (Isat ≥ 1.2–1.5× peak) and ensure SRF exceeds the operating band before final selection.
- Capture nominal and measured L, DCR, Isat, SRF and Q in a one‑page summary to compare candidate parts; this simplifies BOM decisions and highlights deviations from the datasheet.
- Prioritize low DCR and higher Isat for power conversion, and SRF/Q above the filter band for EMI applications to ensure reliable inductor performance.
- Validate with a standard test flow—4‑wire DCR, LCR at operating frequency, impedance sweep, saturation ramp, and thermal rise—then apply derating per thermal curves.
Frequently Asked Questions
How do I verify the Isat rating on a 68 µH wirewound inductor?
Measure by applying a controlled DC current ramp while monitoring inductance with an LCR meter at a low test frequency. Record the current at which inductance drops by the datasheet’s specified percent (commonly 10–30%). Use slow ramps to avoid thermal transients and repeat to confirm consistency.
What is an acceptable DCR range for a 68 µH wirewound inductor in power applications?
Acceptable DCR depends on size and construction but commonly falls between tens and low hundreds of milliohms; evaluate against your conduction loss budget using I²R. If measured DCR exceeds the datasheet by more than ~10%, retest with a 4‑wire setup and inspect leads and solder joints.
How should I document measured inductor performance against the datasheet?
Create a one‑page table listing nominal and measured values for L (with test frequency), DCR, Isat/Irms, SRF, Q, and thermal rise, and include percent deviation. This standardized report lets you compare parts quickly and supports procurement and reliability decisions.